Just found out an hour ago that my PhD adviser retires tonight. Operations Research was the least I learnt from Prof. HDS - despite the fact I used to be clueless enough to think that 'simplex' was probably some kind of vinyl plastic before I enrolled in his graduate program. If Prof. HDS was teaching archaeology I'd be blogging about digging techniques now. He infused a magic into ORMS that has not gone missing yet. His brilliance is stunning and his research contributions, staggering; his students are moved by his compassion, his classes were masterpieces, and many of his colleagues across the university and the world are in respectful awe... Thankfully, it is much simpler for me. He is my teacher, my Guru. Happy retirement, sir. Go easy on the red ink now, maybe?
-----
Wishing readers of dualnoise from around the world a very happy, safe, and healthy new year! Thank you for taking the time to visit this small 'toolers' corner. Feel free to message dualnoise at gmail on topics you would like to read about in 2013.
Monday, December 31, 2012
Friday, December 21, 2012
The Scamster versus the Statesman (or why the Indian National Congress fancies its chances in 2014 and 2019)
A Scam Response Model
The loss due to government-blessed scams and failed populist schemes in India run in the order of Billions and Trillions of Indian Rupees in a country where the impoverished still form a sizable percentage and earning under or around the government designated poverty level of ₹20+ a day (50₹ ~ 1$). To many Indians, such twelve-zero numbers seem fantastic. Thus a person caught stealing thousands in a small town may receive a sound thrashing because people more clearly recognize the utility of amounts that actually show up in their historical experience. However, as the size of the theft increases beyond imaginable sums, the magnitude of the public response does not appear to proportionally increase. The law of diminishing returns seems to kick in, resulting in a concave response function. We postulate that:
Change in Public Response (ΔR) ∝ Change in # of Zeros (ΔZ) in Scam amount S , i.e
R = k log S, where k is a constant to be estimated using historical data.
The assumption of a logarithmic response model turns to be quite useful in the Indian context. For example, if political party A pulls off a 12-zero scam, and party B a 6-zero scam (using a log-10 base):
response(A) = 12k, and response(B) = 6k.
The response is only a factor of 2 more for the scam that was a million times bigger. This makes it easier for party-A to equate itself to party-B in the eyes of the public. It can have its cake and perhaps eat it too. Most Indians would not find it hard to map A & B to their real-life representatives.
Statesman versus Scamster - Round 1
A subjugated, under-informed electorate may exhibit a strong concave response that is characterized by relatively high sensitivity to small thefts at one end, and a disregard for mega-scams at the other end. We postulate that such a population's mental decision making model tends to be (1) myopic, (2) local optimality seeking, and (3) pessimistic (MYLOP). It accepts its terrible local living conditions provided the situation doesn't get perceptibly worse, and votes in polls based on this mental model. The immediate cause-and-effect tied to a local ₹100 theft represents a clear and present risk to current survival and is likely to elicit a swift and violent response, just like a populist cash-equivalent freebie elicits an equally enthusiastic response. However, a gigantic national scam that all but ensures that its future generations will see no improvement is shrugged off. MYLOP behavior is akin to a frog that allows itself to boiled alive because it does not register the gradual increase in water temperature until it is too late.
On the flip side, a government that is largely scam-free and claims to work on long-term growth, but is perceived to have marginally worsened the status quo can get booted out of power in the next election. Asking such a population to endure temporary 'hard choices' in order to be rewarded with medium-to-long term improvement ("no free lunch", "it will get worse before it gets better") implies a non-convex decision model - a hard sell since it clashes with the MYLOP attitude of the population. Scamsters + freebies trumps the Statesman here. Let's dig a little deeper into scams.
How to Hide a Scam?
Answer: A new scam that is an order of magnitude bigger. This can be explained via a mathematical model based on an interesting technical report by John Cook, M. D. Anderson Cancer Center (and author of the Endeavor blog):
The soft maximum of two variables is the function
g(x; y) = log(exp(x) + exp(y))
Given scams S1 and S2, the cumulative response from the public per our postulated model is log(S1 + S2). For example, the Commonwealth Games of India (CWG) plus a few other scams put together was a 9-zero scam, and this was followed by the 2G bandwidth sell-off, which was a thousand times bigger, i.e., a 12-zero scam. The cumulative response is:
log(10^12 + 10^9) = log(10.001 ^ 12) = 12.0005211273k,
a value that is barely more than the response to just the 2G scam itself (12k). In other words, the cumulative response to scams is approximately its soft maximum. The 2G scam simply eclipses the CWG scam in the mind of the public and the media. Even if there were 10 CWG-level scams, they'd be cumulatively eclipsed by a new 2G-level scam for all practical purposes and drop off the radar.
Scamster versus Scamster
Suppose a generally honest political party-B gets greedy seeing the muted public response and its forgiveness of prior scams. If it imitates party-A and pulls off a CWG-level scam, the public's anger would not be a 1000 times smaller. It would only be (12-9)/12 = 25% smaller. Having a clean prior record is not very helpful. Furthermore, if Party-B campaigned on a plank of 'transparent party that is different', it will be perceived as being not very different from party-A (75% alike) despite being 99.9% less corrupt compared to party-A, measured in terms of money siphoned off.
A MYLOP population that is forced to choose between two scamsters (even if their scam sizes are different) will pick the one that offers better freebies. If both provide equal freebies, the MYLOPs are likely to alternate between the two choices, every electoral cycle (e.g state of Tamil Nadu or Uttar Pradesh).
Statesman v/s Scamster - Round 2
Getting out a terrible locally-optimal situation may require a statesman to bring out and maintain a series of organic (sustainable and permanent) and highly visible improvements to first earn the trust of its MYLOP people over a sufficiently long period before unveiling any risky long-term development models. This means a lot of very hard infrastructure work: providing reliable 24x7 electricity, good roads, clean water, primary schools for girls, security for women, etc., to fundamentally alter the decision model of the population from MYLOP to a more optimistic and forward-looking model where people begin to see the possibilities within their grasp. An electorate that is moving along such a positive gradient is more likely to vote to continue along this path of incremental improvement without settling for "dont rock the old boat" and "here and now" populist freebies provided by the scamster. So the statesman can win (e.g. State of Gujarat), but it takes a lot of heavy lifting to be done upfront.
The two seemingly contradictory outcomes from the two state elections that were announced yesterday (Gujarat and Himachal Pradesh), as well as many other Indian elections in the recent past can be plausibly explained using these simple models.
Update 1: 01/21/2013
Interesting quote from 'Steve Jobs' top 5 mistakes" that directly relates to the above idea of hiding scams using bigger scams:
"... The lesson that I take from these defunct products is that people will soon forget that you were wrong on a lot of smaller bets, so long as you nail big bets in a major way (in Jobs's case, the iPod, iPhone, iPad, etc) .."
Monday, December 17, 2012
Collection of Notes on Gun Control
Notes update 1: Dec 18.
Notes update 2: Dec 19.
Notes update 3: Jan 02.
Introduction: The US Outlier
This post is merely an extension of the discussion initiated by Professor Rubin on how not to debate gun control - a discussion that is well worth reading, and one that I have referred to multiple times to try and comprehend a situation that is unique to the US while also sharing certain tragic commonalities with other countries. Much of this post are 'note to self' type remarks for future reference and is a largely unstructured collection of pointers to various articles and personal inferences drawn, which may change as more data becomes available.
The country-independent issues are brought out well in the blog cited in Prof. Rubin's post. That the issue of gun-ownership & deaths also has a US-specific dimension is apparent in this picture presented by a comment on Dr. Rubin's blog.

(link source: https://dl.dropbox.com/u/38668/deaths-vs-guns.png, Courtesy 'Christian')
Macro-Trends
Note however that Newtown was a specific incident (a 'sample of one', as Dr. Rubin notes), whereas this picture above captures macro-trends. Examine these six time-series based facts published by the Washington Post. Assuming this report is factual, the first graphic reconfirms the existence of a unique US situation shown in the first scatter plot. We will focus our attention on just the first plot in this post. There are other interesting plots that show:
- a correlation (not necessarily causality) between stricter gun-controlled US states and lower rates of gun-related deaths
- Southern US has the highest gun-driven fatality rates, while the Northeast has the lowest,
- Gun ownership rates are declining, etc.

The above graphic reveals that overall gun-related fatality rates in the US have monotonically dropped over the last twenty years. Neither the economic boom of the 1990s or the relative economic decline in the last decade, or demographic shifts, etc. has managed to cause a significant inflection at the macro-level. Does that mean that the violence in the society has dropped overall (reduction in market size), and/or have people found alternatives to guns to express their violence (reduction in market-share)? We may need several other charts to answer that. However, purely based on this time-series, it appears that what we have in place has apparently worked relatively well at a macro-level so far. We may be tempted to think that by maintaining the status-quo we are on course to achieve parity with the rest of the pack with respect to this specific metric, but to predict the future is difficult, and requires some knowledge of causality (or at least correlations that can give us a tiny hint).
Significant Incremental Improvement
To motivate the next discussion, let us recall this very useful comment by Dr. Rubin:
"Many (including, I'm willing to bet, Mr. Cassingham) would consider a reduction in mass shootings, or even a reduction in the body counts, as a significant improvement (satisficing)."
From the point of view of the person who wants to act violently, they may well use the first (or most suitable) 'weaponizable' object they can first lay their hands on, and thus a gun or a knife may well represent alternative optimal solutions to a perpetrator. The time durations for:
a. formation of violent intent
b. searching for optimal method to express intent
c. translating intent into reality
seem to be quite important. These time durations may range from a few milliseconds to years. Mr. Cassingham's blog rightly notes in more than one place (and I paraphrase) 'if not guns, then people will always find something else' (in stage (b). True. Addressing the root cause of violence (that arises in a person's mind, and incubated over varying time durations in stage (a)) is very important to the discussion, so that we never get to see the realization of later stages. Perhaps addressing each of these stages (a-c) in some order of priority may help.
Addressing (a) is likely to reduce the probability of future incidents, and is something that may have to be addressed in from the short-term p.o.v (e.g. using medical science), and all the way to the long term where the world can move beyond mere tolerance for differences to mutual respect that celebrates difference. Addressing (b) can reduce the expected consequence of a violent incident, given that a tragic incident does occur (ideally to zero). Addressing (c) appears to be tied to 'last line of defense' mechanisms in place.
One of the key contributions of Operations Research is to recognize alternative optimal solutions. Dr. Rubin's idea of 'optimality versus 'satisficing' seems pretty valuable. From the point of view of expected casualties | given an attempt to mass-injure, a smaller gun, a knife or a baseball bat will probabilistically have a lower casualty rate. An explosive device or a WMD-type gun (like that used in Newtown) is likely to kill more per unit time, on average. Thus from the perspective of a group of trapped victims, horrific as it may be, there may exist a reasonably well-defined ranking of what weapons we least prefer to face (obviously 'facing no weapons' would be ideal). It would beneficial if those who already in stage (b) are always forced to switch to a weapon that is far less deadlier than what was available before. We could think of the deadliness of the weapons permitted as a time-variable 'upper bound' on weapons control. There may be a variety of such bounds along each dimension of the weapon and ammunition, as well as lower bounds on re-training frequency, life-event triggers for re-evaluation of permits, etc. Doing so may provide a gradient along which this discussion can take constructive steps toward reaching the most satisfactory solution by iteratively adjusting these bounds. Again, there are likely to be multiple goals having different priorities as already mentioned in Prof. Rubin's post. The presence of constraints may result in 'satisficing' rather than achieving the desired 'global optimality'. One also wonders about the disruptive impact of 3D printing of weapons on such discussions.

(pic linked from popular science)
What do we do when people have passed through stages (a)-(b), and ready to move to stage (c)? This is the stage, where their intent, as well as degree of planning starts to become visible to others, but the duration may be extremely limited...
Average versus Distribution
The next discussion borrows from a very recent post of another ORMS professor. Dr. Trick wrote about the tricky issue of averages recently in his post "which average do you want?". In addition to the amazing and heroic teachers and staff of Sandy Hook Elementary School, Newton, we just lost eighteen of our most precious and littlest citizens in a matter of minutes after near-complete peace and quiet in that area during the previous 364 days. Such sudden, scarcely comprehensible mass murders (low-probability, catastrophic consequence events) suck the oxygen out of a nation's morale compared to an alternative and equal cumulative tragedy that is well spread out over time and space. Dr. John Cook's blog today talks about the nonlinear effect of 'batch size'. In either of these equally tragic scenarios, from every individual victim's family p.o.v, the anguish and price paid over time is likely to be the same - too high to imagine. Picture 1 of the WaPo article only reveals a reduction in the overall rate, but not the changes in the distribution (victim's age, motive, ..). The nation's response last week leaves little doubt that the distribution of this statistic is just as much if not more important.
Sam Harris notes in his "The Riddle of the gun" :
"... As my friend Steven Pinker demonstrates in his monumental study of human violence, The Better Angels of Our Nature, our perception of danger is easily distorted by rare events. Is gun violence increasing in the United States? No. But it certainly seems to be when one recalls recent atrocities in Newtown and Aurora. In fact, the overall rate of violent crime has fallen by 22 percent in the past decade (and 18 percent in the past five years).
We still have more guns and more gun violence than any other developed country, but the correlation between guns and violence in the United States is far from straightforward...
..... Seventy mass shootings have occurred in the U.S. since 1982, leaving 543 dead. These crimes were horrific, but 564,452 other homicides took place in the U.S. during the same period. Mass shootings scarcely represent 0.1 percent of all murders. When talking about the problem of guns in our society, it is easy to lose sight of the worst violence and to become fixated on symbols of violence ... "
LPHC Events in the Life cycle of a Gun
Finally, to the gun itself. Like a pair of scissors, a kitchen knife, or a car, a gun is a tool that has associated with it a probability for helping and hurting simultaneously whenever it is is handled. Associated with each of these tools is an expected frequency of usage and a risk profile that is context dependent (such as geographical location). The intended target of the primary benefit is largely limited to self and family (who bear the cost of maintenance), whereas the cascading and probabilistic liability is necessarily borne by self, family, and others. Every additional gun, its type, and associated inventory of ammunition, increases this probabilistic liability to the owner, his/her family, and public in a certain way, while altering the expected probabilistic benefit to self in another way. In many instances, both the benefit as well as the liability of acquiring guns appear to be tied to Low-Probability, High-consequence events. In extremely peaceful places, the expected liability may exceed the expected benefit over the lifetime of the weapon, whereas in lawless places, the opposite may hold true.
Ahimsa: Notes from Books
Louis L'Amour noted: "When guns are outlawed, only the outlaws have guns". One of his best books, where violence is almost a living character is 'The Daybreakers" that ultimately ends with a note on the self-realization of the main protagonist leading to his rejection of senseless violence: "We found our home, and we graze and work our acres, and since that day in the street of Mora when I killed Tom Sunday, I have never drawn a gun on any man. Nor will I ...". King Asoka of India fought and won the bloody battle of Kalinga, but was so shocked by the carnage that he gave up further violent conquests and turned toward meditation and the Dharmic way of life. The multi-millennium old Sanskrit Shloka on Ahimsa (non-harming) in Hindu Philosophy says (ref: Hindupedia):
अहिंसा परमो धर्मः
धर्म हिंसा तथीव च
Translation: Non-harming is the ultimate Dharma (very loosely translated as 'righteous way of life'). Harming in service of Dharma (only) is equally virtuous. Consequently, enduring or ignoring, rather than opposing tyranny is not a virtue. The spirit of the second amendment (arguably) and Asimov's three (plus zeroth) laws of robotics come across as examples of the application of this profound Shloka. Some of Gandhi's more head-scratching ideas are apparently due to his ambivalent treatment of the second line of the Shloka, although the Mahatma did say (ref: http://www.mkgandhi.org)
"I do believe that, where there is only a choice between cowardice and violence, I would advise violence... I would rather have India resort to arms in order to defend her honour than that she should, in a cowardly manner, become or remain a helpless witness to her own dishonor. But I believe that nonviolence is infinitely superior to violence, forgiveness is more manly than punishment"
In Remembrance: Dr.L (2007) and Little Maddy (2012). Om Shanti.
Notes update 2: Dec 19.
Notes update 3: Jan 02.
Introduction: The US Outlier
This post is merely an extension of the discussion initiated by Professor Rubin on how not to debate gun control - a discussion that is well worth reading, and one that I have referred to multiple times to try and comprehend a situation that is unique to the US while also sharing certain tragic commonalities with other countries. Much of this post are 'note to self' type remarks for future reference and is a largely unstructured collection of pointers to various articles and personal inferences drawn, which may change as more data becomes available.
The country-independent issues are brought out well in the blog cited in Prof. Rubin's post. That the issue of gun-ownership & deaths also has a US-specific dimension is apparent in this picture presented by a comment on Dr. Rubin's blog.
(link source: https://dl.dropbox.com/u/38668/deaths-vs-guns.png, Courtesy 'Christian')
Macro-Trends
Note however that Newtown was a specific incident (a 'sample of one', as Dr. Rubin notes), whereas this picture above captures macro-trends. Examine these six time-series based facts published by the Washington Post. Assuming this report is factual, the first graphic reconfirms the existence of a unique US situation shown in the first scatter plot. We will focus our attention on just the first plot in this post. There are other interesting plots that show:
- a correlation (not necessarily causality) between stricter gun-controlled US states and lower rates of gun-related deaths
- Southern US has the highest gun-driven fatality rates, while the Northeast has the lowest,
- Gun ownership rates are declining, etc.

The above graphic reveals that overall gun-related fatality rates in the US have monotonically dropped over the last twenty years. Neither the economic boom of the 1990s or the relative economic decline in the last decade, or demographic shifts, etc. has managed to cause a significant inflection at the macro-level. Does that mean that the violence in the society has dropped overall (reduction in market size), and/or have people found alternatives to guns to express their violence (reduction in market-share)? We may need several other charts to answer that. However, purely based on this time-series, it appears that what we have in place has apparently worked relatively well at a macro-level so far. We may be tempted to think that by maintaining the status-quo we are on course to achieve parity with the rest of the pack with respect to this specific metric, but to predict the future is difficult, and requires some knowledge of causality (or at least correlations that can give us a tiny hint).
Significant Incremental Improvement
To motivate the next discussion, let us recall this very useful comment by Dr. Rubin:
"Many (including, I'm willing to bet, Mr. Cassingham) would consider a reduction in mass shootings, or even a reduction in the body counts, as a significant improvement (satisficing)."
From the point of view of the person who wants to act violently, they may well use the first (or most suitable) 'weaponizable' object they can first lay their hands on, and thus a gun or a knife may well represent alternative optimal solutions to a perpetrator. The time durations for:
a. formation of violent intent
b. searching for optimal method to express intent
c. translating intent into reality
seem to be quite important. These time durations may range from a few milliseconds to years. Mr. Cassingham's blog rightly notes in more than one place (and I paraphrase) 'if not guns, then people will always find something else' (in stage (b). True. Addressing the root cause of violence (that arises in a person's mind, and incubated over varying time durations in stage (a)) is very important to the discussion, so that we never get to see the realization of later stages. Perhaps addressing each of these stages (a-c) in some order of priority may help.
Addressing (a) is likely to reduce the probability of future incidents, and is something that may have to be addressed in from the short-term p.o.v (e.g. using medical science), and all the way to the long term where the world can move beyond mere tolerance for differences to mutual respect that celebrates difference. Addressing (b) can reduce the expected consequence of a violent incident, given that a tragic incident does occur (ideally to zero). Addressing (c) appears to be tied to 'last line of defense' mechanisms in place.
One of the key contributions of Operations Research is to recognize alternative optimal solutions. Dr. Rubin's idea of 'optimality versus 'satisficing' seems pretty valuable. From the point of view of expected casualties | given an attempt to mass-injure, a smaller gun, a knife or a baseball bat will probabilistically have a lower casualty rate. An explosive device or a WMD-type gun (like that used in Newtown) is likely to kill more per unit time, on average. Thus from the perspective of a group of trapped victims, horrific as it may be, there may exist a reasonably well-defined ranking of what weapons we least prefer to face (obviously 'facing no weapons' would be ideal). It would beneficial if those who already in stage (b) are always forced to switch to a weapon that is far less deadlier than what was available before. We could think of the deadliness of the weapons permitted as a time-variable 'upper bound' on weapons control. There may be a variety of such bounds along each dimension of the weapon and ammunition, as well as lower bounds on re-training frequency, life-event triggers for re-evaluation of permits, etc. Doing so may provide a gradient along which this discussion can take constructive steps toward reaching the most satisfactory solution by iteratively adjusting these bounds. Again, there are likely to be multiple goals having different priorities as already mentioned in Prof. Rubin's post. The presence of constraints may result in 'satisficing' rather than achieving the desired 'global optimality'. One also wonders about the disruptive impact of 3D printing of weapons on such discussions.

(pic linked from popular science)
What do we do when people have passed through stages (a)-(b), and ready to move to stage (c)? This is the stage, where their intent, as well as degree of planning starts to become visible to others, but the duration may be extremely limited...
Average versus Distribution
The next discussion borrows from a very recent post of another ORMS professor. Dr. Trick wrote about the tricky issue of averages recently in his post "which average do you want?". In addition to the amazing and heroic teachers and staff of Sandy Hook Elementary School, Newton, we just lost eighteen of our most precious and littlest citizens in a matter of minutes after near-complete peace and quiet in that area during the previous 364 days. Such sudden, scarcely comprehensible mass murders (low-probability, catastrophic consequence events) suck the oxygen out of a nation's morale compared to an alternative and equal cumulative tragedy that is well spread out over time and space. Dr. John Cook's blog today talks about the nonlinear effect of 'batch size'. In either of these equally tragic scenarios, from every individual victim's family p.o.v, the anguish and price paid over time is likely to be the same - too high to imagine. Picture 1 of the WaPo article only reveals a reduction in the overall rate, but not the changes in the distribution (victim's age, motive, ..). The nation's response last week leaves little doubt that the distribution of this statistic is just as much if not more important.
Sam Harris notes in his "The Riddle of the gun" :
"... As my friend Steven Pinker demonstrates in his monumental study of human violence, The Better Angels of Our Nature, our perception of danger is easily distorted by rare events. Is gun violence increasing in the United States? No. But it certainly seems to be when one recalls recent atrocities in Newtown and Aurora. In fact, the overall rate of violent crime has fallen by 22 percent in the past decade (and 18 percent in the past five years).
We still have more guns and more gun violence than any other developed country, but the correlation between guns and violence in the United States is far from straightforward...
..... Seventy mass shootings have occurred in the U.S. since 1982, leaving 543 dead. These crimes were horrific, but 564,452 other homicides took place in the U.S. during the same period. Mass shootings scarcely represent 0.1 percent of all murders. When talking about the problem of guns in our society, it is easy to lose sight of the worst violence and to become fixated on symbols of violence ... "
LPHC Events in the Life cycle of a Gun
Finally, to the gun itself. Like a pair of scissors, a kitchen knife, or a car, a gun is a tool that has associated with it a probability for helping and hurting simultaneously whenever it is is handled. Associated with each of these tools is an expected frequency of usage and a risk profile that is context dependent (such as geographical location). The intended target of the primary benefit is largely limited to self and family (who bear the cost of maintenance), whereas the cascading and probabilistic liability is necessarily borne by self, family, and others. Every additional gun, its type, and associated inventory of ammunition, increases this probabilistic liability to the owner, his/her family, and public in a certain way, while altering the expected probabilistic benefit to self in another way. In many instances, both the benefit as well as the liability of acquiring guns appear to be tied to Low-Probability, High-consequence events. In extremely peaceful places, the expected liability may exceed the expected benefit over the lifetime of the weapon, whereas in lawless places, the opposite may hold true.
Ahimsa: Notes from Books
Louis L'Amour noted: "When guns are outlawed, only the outlaws have guns". One of his best books, where violence is almost a living character is 'The Daybreakers" that ultimately ends with a note on the self-realization of the main protagonist leading to his rejection of senseless violence: "We found our home, and we graze and work our acres, and since that day in the street of Mora when I killed Tom Sunday, I have never drawn a gun on any man. Nor will I ...". King Asoka of India fought and won the bloody battle of Kalinga, but was so shocked by the carnage that he gave up further violent conquests and turned toward meditation and the Dharmic way of life. The multi-millennium old Sanskrit Shloka on Ahimsa (non-harming) in Hindu Philosophy says (ref: Hindupedia):
अहिंसा परमो धर्मः
धर्म हिंसा तथीव च
Translation: Non-harming is the ultimate Dharma (very loosely translated as 'righteous way of life'). Harming in service of Dharma (only) is equally virtuous. Consequently, enduring or ignoring, rather than opposing tyranny is not a virtue. The spirit of the second amendment (arguably) and Asimov's three (plus zeroth) laws of robotics come across as examples of the application of this profound Shloka. Some of Gandhi's more head-scratching ideas are apparently due to his ambivalent treatment of the second line of the Shloka, although the Mahatma did say (ref: http://www.mkgandhi.org)
"I do believe that, where there is only a choice between cowardice and violence, I would advise violence... I would rather have India resort to arms in order to defend her honour than that she should, in a cowardly manner, become or remain a helpless witness to her own dishonor. But I believe that nonviolence is infinitely superior to violence, forgiveness is more manly than punishment"
In Remembrance: Dr.L (2007) and Little Maddy (2012). Om Shanti.
Thursday, December 13, 2012
The King and the Vampire - 2: Cricketing Conundrum
This is the second episode in our 'King Vikram and the Vetaal' (Vampire) series, based on the simple but nice Indian story-telling format. Read the first K&V story here.
Dark was the night and weird the atmosphere. It rained from time to time. Eerie laughter of ghosts rose above the moaning of jackals. Flashes of lightning revealed fearful faces. But King Vikram did not swerve. He climbed the ancient tree once again and brought the corpse down. With the corpse lying astride on his shoulder, he began crossing the desolate cremation ground. "O King, it seems that you are generous in your appreciation for the analytics-based Duckworth-Lewis method used in weather-interrupted cricket matches. But it is better for you to know that there are situations where the D/L method invariably results in complaints, especially in T20 cricket. Let me cite an instance. Pay your attention to my narration. That might bring you some relief as you trudge along," said the vampire that possessed the corpse.

The cricketing vampire went on:
In a recent Australian T20 match, the D/L method did not just perform badly, it actually failed. Here's why:
Team-A batted first, played terribly and made just 69 runs.
Team-B chasing 70 for a win, got off to a flyer and scored 29 of 2 overs before rain interrupted the match. However, the D/L revised target for Team-B only comes into play when at least 5 overs have been completed by both teams... Anyway, here's what transpired, per cricinfo:

(pic source link: omshivam.files.wordpress.com)
Dark was the night and weird the atmosphere. It rained from time to time. Eerie laughter of ghosts rose above the moaning of jackals. Flashes of lightning revealed fearful faces. But King Vikram did not swerve. He climbed the ancient tree once again and brought the corpse down. With the corpse lying astride on his shoulder, he began crossing the desolate cremation ground. "O King, it seems that you are generous in your appreciation for the analytics-based Duckworth-Lewis method used in weather-interrupted cricket matches. But it is better for you to know that there are situations where the D/L method invariably results in complaints, especially in T20 cricket. Let me cite an instance. Pay your attention to my narration. That might bring you some relief as you trudge along," said the vampire that possessed the corpse.
(pic source link: pryas.wordpress.com)
The cricketing vampire went on:
In a recent Australian T20 match, the D/L method did not just perform badly, it actually failed. Here's why:
Team-A batted first, played terribly and made just 69 runs.
Team-B chasing 70 for a win, got off to a flyer and scored 29 of 2 overs before rain interrupted the match. However, the D/L revised target for Team-B only comes into play when at least 5 overs have been completed by both teams... Anyway, here's what transpired, per cricinfo:
".. Under the Duckworth/Lewis method the target for the Stars (Team-B) was
recalculated. The calculation, which itself has been disputed, ensured
that the Stars required just six runs from five overs. Even though the
Stars had already reached and exceeded the target, given the D/L target
had changed when overs were lost play needed to resume to set the
revised target. Play resumed at 7.52pm after a minor delay. Hilton Cartwright bowled one
ball to Rob Quiney, who allowed it to pass through to the keeper, and
the match was over as the Stars had reached their revised target after
2.1 overs."
So tell me King Vikram, What is the correct result? Did the Stars win because they achieved the revised target, or should the points be shared because the required five overs were not completed? Answer me if you can. Should you keep mum though you may know the answers, your head would roll off your shoulders!"
King Vikram was silent for a while, and then spoke: "Vetaal, unlike the last time, this is a tough one, so first consider this counter-factual:
King Vikram was silent for a while, and then spoke: "Vetaal, unlike the last time, this is a tough one, so first consider this counter-factual:
The Stars continue to play for another 1.4 overs, and are bowled out for 29. If the revised target when they were 29/9 was 30, then Team-A (Scorchers) would have won the match. Therefore, even though the Stars were temporarily ahead of the revised target, that target is not static since the minimum overs were not completed. The D/L based revised target is computed based on two resource constraints, taking into account the runs to be scored and wickets lost. It can change over time and the Scorchers still had a theoretical chance, however small, of winning the match by taking wickets.
However, here's another situation. Suppose Team-B was 29/9 after 2 overs, and the revised 5-over D/L target was 52. Team-B gets to 57/9 in 4.5 overs, hitting the last ball for a six before rains come down and and stop the game permanently. In this case, the D/L target cannot increase further, given that Team-B is already 9-down. In this case, Team-A has zero chance of winning the match. Team-B should be declared the winner even though the minimum overs have not been bowled.
1. For the current game, the points have to shared. This answers your specific question.
2. If a match ends before the minimum overs are completed, the chasing team can be declared the winner only if they have achieved a score that equals or exceeds the highest of all possible revised D/L targets that can occur for the fixed number of overs possible. In this example, Team-B would have been declared the winner if they scored at least 52.
3. However, I suspect that the cricket council will simply enforce the minimum-over rule as a hard-constraint that must be satisfied before the match can be decided in favor of one team over the other.
3. However, I suspect that the cricket council will simply enforce the minimum-over rule as a hard-constraint that must be satisfied before the match can be decided in favor of one team over the other.
No sooner had King Vikram concluded his answer than the vampire, along with the corpse, gave him the slip.
(pic source link: omshivam.files.wordpress.com)
The Vetaal apparently agreed with Vikram's answer, but do you? If not, explain why. There's no penalty for trying!
Analytics and Cricket - X : Reader's Response to DRS Debate
It's getting increasingly difficult to post on cricket given that the Indian cricket team is getting ripped to shreds by half-decent opposition despite home-ground advantage. Of course, as noted in an
earlier post,
home courts can significantly increase the chance of a choke, and this may well be happening. Mahendra Singh Dhoni (if
by some chance, still remains the captain of the Indian team
after the current cricket series) can win a few more tosses if he can exploit this idea. Desperate times call for analytical measures!
Meanwhile, an astute reader emailed a detailed response to the Bayes-theorem based analysis of the Decision Review System (DRS) used in cricket, which was posted on this blog a few months ago. He made some very pertinent points along with some brilliant comments on the game, which led to an informative exchange that will be carried in the next couple of cricket-related posts. Here is our the 2x2 color coded DRS matrix again for reference.

Raghavan notes:
".... I must question some of the steps in your analysis:
1. In your derivation you use P(RED|OUT) = 0.95. I think this is true only if all decisions are left to DRS. You have considered only those decisions that are deemed not out by the umpire and referred. The 95% number does not hold for these selected cases. It would be lower. Here's the rationale:
There is a high degree of correlation between DRS and umpires decisions; understandably so, since all those "plumb" decisions are easy for both, the umpire and DRS. Bowlers would rarely review these decisions. For the 10% or so cases when the umpire rules the batsman not out incorrectly, the DRS would very likely have a lower accuracy than its overall 95%.
2. If you assume the "red zone" in the picture is sufficiently small compared to 10%, you would get the accuracy of DRS being about 50% for the cases when the umpire incorrectly rules not out. Now, this needs a bit of explanation.
Let's assume that whenever the umpire rules out correctly, the DRS also rules correctly (well, at least close to 100% of the time). Note that this does not include just the referrals, but also all the "easy and obvious" decisions that are not referred. Since the overall accuracy of DRS is 95%, of the 10% that the umpire incorrectly rules not out, DRS also gets it wrong for half of those 10% cases giving an overall 95% accuracy. In case the "red zone" corresponding to incorrect OUT decisions of the DRS is not close to zero, but say 2% (which is large in my opinion), the DRS accuracy in the bowler referred cases we are talking of would by 70% rather than 50%. Still way lower than the 95% overall accuracy. [I have made some approximations here, but the overall logic hold]
3. Now, if you plug 70% instead of 95% in your next steps, you get P(OUT|RED) = 88.6%. Nothing wrong with this number, except when you compare it with the 90% accuracy of umpires. It's not apples to apples. P(OUT|Umpire says OUT) is not 90% if you only considered referred cases. It's actually a conditional probability:
P(OUT|Umpire says OUT, BOWLER REFERS). I don't have enough information to estimate this, but I'm sure you'll agree it's lower than 90% since bowlers don't refer randomly.
4. I think the right comparison is between the what the final decision would be with and without DRS. There is no doubt that umpire + DRS referrals improve overall accuracy of decisions. I admit that false positives would increase marginally, which affects batsmen more than bowlers because of the nature of the game (a batsman has no chance of a comeback after a bad decision, while a bowler does). But I think it is because of the way Hawk-eye is used today.
5. In my opinion, the main problem with DRS is that its decision are made to be black and white. There should be a reliability measure used. A very rudimentary form of this currently used in LBW decisions. For example, if the umpire has ruled out, to be ruled not out by DRS the predicted ball path has to completely miss the stumps. But if the umpire has ruled not out, the predicted path should show that at least half the ball is within the stumps for the decision to be over-turned. Eventually, I feel Hawk eye would be able to estimate the accuracy of it's decision. I'm sure Hawk eye has statistics on it's estimates. The standard deviation of the estimate would depend on several factors - (1) how far in from of the stumps has the ball struck the pads (2) How close to the pads has the ball pitched (hawk-eye needs at least a couple of feet after the bounce to track the changed trajectory), (3) Amount of turn, swing or seam movement observed.
If a standard deviation (sigma) can be estimated, then a window of say +/- 3*sigma could be used as the "region of uncertainty". If the ball is predicted to hit the stumps within this region of uncertainty then the decision should be out. Of course the more complicated it gets to explain to the viewer, the more resistance there would be to be accepted. But if it is the right way, it will eventually get accepted. Take DL method for example. A vast majority of viewers don't understand it fully, but most of them know that it is fair.
6. There's another aspect that needs to be investigated. It's about how the decision of the on-field umpire is affected by the knowledge that DRS is available. "
Followups will be carried in a subsequent post. Blog-related emails can be sent to: dual[no space or dot here]noise AT gmail dot com, or simply send a tweet.
Meanwhile, an astute reader emailed a detailed response to the Bayes-theorem based analysis of the Decision Review System (DRS) used in cricket, which was posted on this blog a few months ago. He made some very pertinent points along with some brilliant comments on the game, which led to an informative exchange that will be carried in the next couple of cricket-related posts. Here is our the 2x2 color coded DRS matrix again for reference.
Raghavan notes:
".... I must question some of the steps in your analysis:
1. In your derivation you use P(RED|OUT) = 0.95. I think this is true only if all decisions are left to DRS. You have considered only those decisions that are deemed not out by the umpire and referred. The 95% number does not hold for these selected cases. It would be lower. Here's the rationale:
There is a high degree of correlation between DRS and umpires decisions; understandably so, since all those "plumb" decisions are easy for both, the umpire and DRS. Bowlers would rarely review these decisions. For the 10% or so cases when the umpire rules the batsman not out incorrectly, the DRS would very likely have a lower accuracy than its overall 95%.
2. If you assume the "red zone" in the picture is sufficiently small compared to 10%, you would get the accuracy of DRS being about 50% for the cases when the umpire incorrectly rules not out. Now, this needs a bit of explanation.
Let's assume that whenever the umpire rules out correctly, the DRS also rules correctly (well, at least close to 100% of the time). Note that this does not include just the referrals, but also all the "easy and obvious" decisions that are not referred. Since the overall accuracy of DRS is 95%, of the 10% that the umpire incorrectly rules not out, DRS also gets it wrong for half of those 10% cases giving an overall 95% accuracy. In case the "red zone" corresponding to incorrect OUT decisions of the DRS is not close to zero, but say 2% (which is large in my opinion), the DRS accuracy in the bowler referred cases we are talking of would by 70% rather than 50%. Still way lower than the 95% overall accuracy. [I have made some approximations here, but the overall logic hold]
3. Now, if you plug 70% instead of 95% in your next steps, you get P(OUT|RED) = 88.6%. Nothing wrong with this number, except when you compare it with the 90% accuracy of umpires. It's not apples to apples. P(OUT|Umpire says OUT) is not 90% if you only considered referred cases. It's actually a conditional probability:
P(OUT|Umpire says OUT, BOWLER REFERS). I don't have enough information to estimate this, but I'm sure you'll agree it's lower than 90% since bowlers don't refer randomly.
4. I think the right comparison is between the what the final decision would be with and without DRS. There is no doubt that umpire + DRS referrals improve overall accuracy of decisions. I admit that false positives would increase marginally, which affects batsmen more than bowlers because of the nature of the game (a batsman has no chance of a comeback after a bad decision, while a bowler does). But I think it is because of the way Hawk-eye is used today.
5. In my opinion, the main problem with DRS is that its decision are made to be black and white. There should be a reliability measure used. A very rudimentary form of this currently used in LBW decisions. For example, if the umpire has ruled out, to be ruled not out by DRS the predicted ball path has to completely miss the stumps. But if the umpire has ruled not out, the predicted path should show that at least half the ball is within the stumps for the decision to be over-turned. Eventually, I feel Hawk eye would be able to estimate the accuracy of it's decision. I'm sure Hawk eye has statistics on it's estimates. The standard deviation of the estimate would depend on several factors - (1) how far in from of the stumps has the ball struck the pads (2) How close to the pads has the ball pitched (hawk-eye needs at least a couple of feet after the bounce to track the changed trajectory), (3) Amount of turn, swing or seam movement observed.
If a standard deviation (sigma) can be estimated, then a window of say +/- 3*sigma could be used as the "region of uncertainty". If the ball is predicted to hit the stumps within this region of uncertainty then the decision should be out. Of course the more complicated it gets to explain to the viewer, the more resistance there would be to be accepted. But if it is the right way, it will eventually get accepted. Take DL method for example. A vast majority of viewers don't understand it fully, but most of them know that it is fair.
6. There's another aspect that needs to be investigated. It's about how the decision of the on-field umpire is affected by the knowledge that DRS is available. "
Followups will be carried in a subsequent post. Blog-related emails can be sent to: dual[no space or dot here]noise AT gmail dot com, or simply send a tweet.
Friday, December 7, 2012
The Rose and The Chrysanthemum
An extended tweet triggered by recalling an old joke.

(pic: Wikipedia)
Girl: look! a rose!
Boy: No, that's a Chrysanthemum.
Girl: Ok, then spell it
Boy: Kri--, no. Ch-ri-san... you're right, that's a rose.
This is an example of user-optimality.
Wednesday, December 5, 2012
Entropic Decision Optimization using Amazon's Add-on Item Constraint
When we shop at Amazon, we often end up with about 23-24$ worth of stuff in our cart, short of the 25$ threshold that gives us free shipping. As far as I could remember, we could always add small items (like a box of paper-clips) to satisfy this knapsack constraint. In other words, we could reasonably approximate this discrete threshold satisfaction problem as a continuous knapsack constraint, which is amenable to "greedy" approaches.
A Tougher Knapsack Problem
Amazon has now designated many items whose values are roughly $5 or less, to be "add on" items, and is marketed as follows:
"The new Add-on program allows Amazon to offer thousands of items at a low price point that would be cost-prohibitive to ship on their own... Add-on Items ship with orders that include $25 or more of items shipped by Amazon, and you can get them delivered to your doorstep with free shipping ....Previously it was only possible for us to offer many of the items like these in large multi-pack sizes... "
Speaking purely from a personal point of view, it feels like this "benefit" actually hurts customers by placing additional restrictions (on the other hand, there may well be an incremental benefit to a section of customers) since such low-priced items cannot be used to satisfy our knapsack constraint, and we may end up purchasing a bit more than the 25-26$ we achieved before, or pay for shipping. This new 'add on item' constraint requires us to solve a discrete knapsack problem to best satisfy the free-shipping threshold. Although NP-Hard in theory, it is well-known that we can find optimal or near-optimal solutions to practical integer knapsack problems in quick time using specialized algorithms.
Entropic Decision Optimization (EDO)
This add-on constraint can be used to illustrate the EDO approach that we discussed just a couple of days ago. Consider the following heuristic algorithm:
Start with a super-set of items (wish list) we intend to purchase over the next few weeks/months. This list is constantly updated over time. Any time we want to make a purchase, assign a priority score to each item that is positively correlated with the time-sensitivity of its purchase (an item that we 'must' purchase right away goes directly into the cart). Then solve the following integer knapsack problem:
Maximize (sum of scores of chosen items)
subject to:
1) sum($ value of chosen items) ≤ 30
2) Bounds on the quantity of purchase of each item.
We picked 30$ as the RHS assuming that we can easily find a 30$ or higher-valued basket using our old "continuous" approximation. If we use a dynamic programming approach, we also get as a by-product, the solutions for a range of RHS values less than $30. Pick the solution corresponding to the smallest capacity at or exceeding $25. If we have very few choices, we can simply enumerate the possibilities.
We chose as a measure of "entropy" in our super set, the total time-sensitivity of super set, and selecting relatively time-critical items reduces entropy. Our EDO algorithm will usually do a good job of limiting the entropy in our wish list, but over time we may end up with quite a few "hot" items that never seem to fit the knapsack well and kept getting rejected, indicating that our list has reached a state of high entropy. We are forced to make suboptimal choices and stray far away from the optimal $25 target. It does feel like we are playing Tetris.
Sunday, December 2, 2012
Managing Black Swans using Operations Research
LPHC Events
The importance of modeling Low-Probability High Consequence (LPHC) events, popularized in recent times by Nassim Taleb as "Black Swans" has been recognized by Operations Researchers for quite some time. As this recent article (via Reddit) implies, it is both demystifying and useful to talk of consequential rare events in terms of a range of probabilities rather than a potentially misleading binary classification of B/W Swans. For example, LPHC modeling is critical to identifying min-risk Hazmat routes, a popular research area within OR. In addition to standard risk measures such as the expected probability of an accident occurring on a given route, or the total expected cost of a chosen route, planners also explicitly limit the conditional expected cost associated with a catastrophic event along a prescribed route if in fact such an event were to occur along any link in the route. Practical OR models aim for robustness by never focusing on just one objective given that extremal solutions tend to faithfully follow the no-free-lunch rule. OR Planners typically track a variety of risk objectives and seek alternative optimal solutions that adequately address the multiple modes of failure that can be triggered over time.
Narrative-Rational, Time-Dependent World
Until recently, I thought that coin tosses were 50-50 events. In an unbiased, narrative-free world they are, but as Venkatesh Rao argues in his book 'Tempo' (and this understanding is subject to my limited ability to grasp and interpret the dense writing style employed in this book) that there is no absolutely narrative-independent useful model of rational decision-making: "... there is no meaningful way to talk about specific decisions outside of a narrative frame and a concrete context, any more than it is possible to talk about physics without reference to a specific, physical coordinate frame ..."
Rao agrees with Taleb's 'Black Swan' book claim that introducing a narrative injects bias, but is disinclined to adopt the approach of severing the narrative from the decision making process. Instead, Rao chooses to embrace narrative and his book examines elegant and sound decision-making within a given enactment over the narrative clock. On the other hand, Venkatesh Rao feels that the narrative-independent "Calculative rational decision-making finesses situatedness by working only with highly controlled clocks. When you start this way, seductive general theories of decision-making take center stage, and local conditions are forgotten, minimized or dismissed as “details.”. Perhaps, by zooming in on the narrative of a guy who makes decisions based on the outcome of 'vigorously tossing and catch a coin', researchers were able to recognize these subtle 'local conditions' that allowed them to predict the bias in real-life coin tosses.
Risk and Analytics
How do we deal with risk associated with decisions prescribed by today's predictive analytical models embedded within decision support systems? This is an important issue since our underlying predictive analytical models are calibrated using noisy data generated from past decisions. As long as our recommendations lie within the historical range, its consequences can be expected to be reasonably bounded. However, once we create new history (e.g. pricing a product at a value never ever done before), our predictive model is forced to extrapolate. Per 'Tempo', we now exit a closed world and enter an open one, where "The open world is a world that includes what Donald Rumsfeld called “unknown unknowns” and Nicholas Nassim Taleb calls “black swans” (rare, highly consequential events)." In such instances, history is of limited use as a guide, and statistically driven analytics can fail. Rao says that such calculative rational [analytical models]: "... can be viewed as a way of systematically leveraging or amplifying intuition. But intuition amplified through calculative-rational models, while necessary, is not sufficient for true risk management.".
Welcome to Entropic Decision Optimization
One option to survive the open world is to have in place a theoretical model that anticipates the consequences of such unforeseen events. 'Tempo' suggests that "Informal human mental models can comprehend open worlds because they can contain things that haven’t been understood: a high entropy state." Although Rao rightly suggests that analytical methods for such weakly understood "high entropy" situations are in its infancy, having even a simple and reasonable model helps. For example, in a recently patented pricing optimization method, we attempt to reduce a user-specified measure of 'entropy' (in the form of business disruption) associated with recommendations, which has worked reasonably well within a retail narrative so far. However, in the narrative-rational world of 'Tempo', the laws of thermodynamics dictate that all good things must come to an end regardless of whether we encounter a black swan or not. A simple "Frankenstein design principle" that we discussed a couple of years ago suggests that the design of particularly complex systems should explicitly assume a failure at some point in time. 'Tempo' chooses the example of 'Tetris' (rather than Blackjack/Poker, that analytics folks more commonly use) to illustrate that we can maximally delay the inevitable by chalking up elegant but temporary wins via better entropic decision making. A time-knapsack, if you will.
Monday, November 26, 2012
Review of WVLPSolver: A Java-based Linear Programming Library
Pure Java based optimization tools released under benign licenses are popular in decision-analytics embedded industrial applications. They reduce maintenance efforts and deployment costs, keeping IT managers, analytical support engineers, and developers happy. No platform-specific issues to deal with. No license and patent infringement headaches.... It's a win-win for everybody, provided these 'free' analytical tools withstand the rigors of a production environment.
Recap: This tab summarized a set of pure Java tools a while ago here, talked about a DIY Java solver here that gets you to within a factor of 10-20 of CPLEX on combinatorial LPs, and chatted about "GooPLEX v1.0" some years ago here.
The new WVLPSolver library is introduced here (courtesy: Bharath Krishnan, data scientist at CQuotient). This new solver is worth a look because its v1.0 appears to be more well thought out compared to the initial version of 'Gooplex'. In particular, WVLPSolver seems to employ a revised simplex scheme that would allow it to work with a minimal simplex tableau (see an old but remarkable (if extreme) illustration of this advantage). Per the introductory post, it employs the reliable Colt library, and is released under the Apache license. These three factors alone may allow this tool to become a useful workhorse in specific situations ("think small"). Great work by the developers, and hope they continue to improve upon this initial release.
Big Data produces a variety of decision problems (recent post related to this topic). In some situations, and depending on the problem structure, you may end up needing to solve tons of small but independent optimization problems, and in other cases, relatively fewer giant monoliths where a considerable amount of sophistication is required to produce consistently good answers. In the former case, an IT manager has to decide whether he needs to budget for a million-instance licensed version of an industrial-strength solver that works cross-platform, or hack-a-heuristic that generates "user-optimal solutions" but may end up confusing users, or go with a nice, pure Java LP brew. Each option has its advantages and disadvantages depending on the context. For analytics start-ups that offer solutions having a relatively small OR footprint, the last option may sound appealing.
Monday, November 12, 2012
Operation Red Lotus and Jules Verne
Around the World in 80 Days
One of the few positive side effects of Hurricane Sandy knocking out power for nearly a week was the rediscovery of a childhood joy of reading history books and stories of valiant Indian queens and kings by the candlelight. Globe-trotting dreams of kids in 1970s socialist India who couldn't afford to set foot on an airplane were kindled by reading and re-reading stories like Jules Verne's fascinating adventure travelogue 'Around the World in 80 Days', a book written a hundred years earlier in 1873.
Indian Rebel
Just a few years before Jules Verne wrote some of his most popular books, the English government was engaged in a bloody, all-out war for economic power in the Indian subcontinent. The rebellion against the colonizers in 19th century India was not just a local mutiny of Sepoys (hired soldiers), and not just an uprising of the peasants; native rulers (Rajas), dashing queens (Ranis), naturalized Indian kings of the dying Mughal dynasty, military leaders, intellectuals, priests, bankers, traders, farmers, ... entire populations participated in the struggle to free India socially, economically, and culturally in what came to be recorded as the first war of Indian Independence fought in 1857. This is one of the many excellent findings recorded in the historical book "Operation Red Lotus" written by Parag Tope, a descendent of Tatya Tope, chief coordinator of the Indian war machine during that time period.
Jules Verne's Captain Nemo of 1870 appears to be a character straight out of this war. A hi-tech sea-faring native prince seeking vengeance against the English, Nemo is not far from reality. Native rulers set up navies that relied on the construction of relatively sophisticated ships to safeguard overseas trade interests that were being overrun by the piracy of the English East India Company (EEIC). This is hardly surprising given that the world's first dockyard was built in India and the maritime prowess of native kings on both sides of the Indian coast is legendary. However, the key battles of the 1857 war were fought inland in Northern India.
Operation Red Lotus

A wealth of information from recently recovered original correspondence to Tatya Tope during this time period appears to have encouraged the writing of this book. This excellent review summarizes the findings. While there is ample evidence to suggest that the strategy and tactics employed by the Indian resistance in 1857 was indicative of a comprehensive and long-term approach, claims of an sustainable war effort cannot be taken seriously (to paraphrase Gen. Omar Bradley) unless it can be shown that there was a feasible logistics solution in place. Operation Red Lotus (ORL) answers this question in the affirmative.

pic source
The Lotus Code: Operations Research and Logistics?
ORL is mainly about how Tatya Tope and other leaders on the Indian side designed a simple and neat supply chain to support the war effort and maintain an army of newly unemployed native soldiers, bereft of any provisioning infrastructure. Tatya's first step, like we do in the corporate world today, was to forecast enterprise-level demand - but he had to do this without tipping off the Red Shirts. Toward this, he exploited the contempt the colonizers had for 'backward' Indian rituals and traditions. Tatya Tope secretively sampled demands at the platoon level using a red-lotus based numerical code. The English were puzzled to see a spate of red lotuses being passed around the garrisons in many cities they controlled and initially attributed it to yet another weird 'blood red' native custom. The number of petals in a red lotus is approximately the same as the number of soldiers in an EEIC platoon.
 (source colorbox.com)
A native soldier who volunteered would pluck a petal and pass the flower on. After all soldiers made their choice, what was left of the flower was sent back to Tatya. By counting the reeds and/or the remaining petals in a returned lotus from a particular geographical location, noting the number of lotus-sampled platoons, and rolling up these estimates to a regimental level, Tatya was able to predict the approximate size of the native army by location. Having this fundamental information at hand, the planners calculated the provisioning required to sustain the war effort in its various stages, and also finalize the line of attack to capture and hold Delhi, the capital, as well as other strategically important cities. The next challenge was to geographically allocate supplies to satisfy this location-specific demand forecast given that the emerging native army did not have the resources or the time to rapidly create and manage their own own supply line. The only viable solution was to outsource this task, which was accomplished via the Chapati (an unleavened Indian bread) code.
The Chapati Code
After the flood of lotuses, the English were bemused to see Chapatis being exchanged by the chiefs of some villages. Alarm bells went off and they managed to intercept Chapatis embedded with lotus seeds.
 (source food fun freak blog)
The English concluded that this was not another strange custom and that the exchange of lotuses and Chapatis was some kind of a secret handshake. Red lotuses weren't found in the hands of villagers, and seeded Chapatis were not found in garrisons. What historians did not fully realize was that the lotus and the Chapati distribution were the code; not merely Boolean flags, but a vector representation of numerical information relating to troop strength and battle plans. We now know that the Indian war planners sent Chapatis to the various villages along a directional chain graph on a Euclidean plane whose source was a major garrison, and the sink was an important military objective.
 [ORL book extract]
The men of the villages that were ready to support the war effort would requisition and stock food grains, and the women of the village would be required to prepare food in quantities proportional to the number of Chapatis they received. The village chief would pass on a similar number of Chapatis to the next village in the designated chain. There is little doubt now that this was a coordinated and planned war to achieve self-rule.
Breaking Down The Supply Chain
When the time was ripe, the sepoys mutinied on the pretext of greased cartridges (immortalized by the legend of Mangal Pandey), catching the EEIC and the Victorian government in England off guard, and the initial phase of the war went against the colonizers. However, once they recognized the logistical method employed by the natives, the reprisals were eerily Nazi-like: swift, decisive and genocidal, and in keeping with a pattern that was repeated a few times before India's political independence in 1947. Villages on these chain graphs that supported the war effort were interdicted. Emergency laws were enacted that essentially gave English officers the license to kill civilians based on suspicion. Large populations, including women and children were wiped out, successfully disrupting the Indian supply chain.
 (source: wikipedia)
 (source columbia.edu)
Once the logistical backbone was broken, it was a matter of time before the colonials won the war. However, it turns out that the war also had some cascading international effects.
Global impact of the 1857 Indian War of Independence
The London government withdrew huge sums of money from their banks and investments, including prominent financial institutions in the U.S, to raise sufficient capital to fund and ship out tens of thousands of fresh troops to India to win the war, while publicly spinning this fiasco as a localized case of mutiny. This behavior did not escape the attention of some Americans who questioned the official version.
.
 [ORL book extract, pages 86-87]
ORL notes another pertinent question that George Train asked: "England says they are short of funds. Where are the hundreds of millions of silver that have been shipped there [India], disturbing the currency of the world?
The withdrawal of such huge sums of money by the English from US banks exacerbated the panic of 1857, and the resultant liquidity problem severely impacted the Northern states in the US besides triggering the world's first ever global economic crisis. Furthermore, the war hit the EEIC-pirated textile goods exported from India to the west, which reacted by sourcing more cotton from the southern US states that was being produced at even cheaper rates using African slave labor, thereby boosting the Confederate economy and morale. Thus, the Anglo-Indian war of 1857 appears to also have had some impact on the subsequent American civil war of 1861-65.
Jules Verne's Phineas Fogg is most likely based on George Train, a remarkable real-life American adventurer-entrepreneur who went around the world a few times, including a round trip in 67 days.
Legacy
It is less known that the Indian resistance achieved a few tangible victories for India in the long term. For brevity, we will have to leave that discussion for another day. India lost the 1857 war but those who resisted genocide became legend; none more so than the heroic young queen, Rani Lakshmi Bai. This coming Monday, November 19 is her birthday. Reading the immortal line in the Hindi poem about her in the candlelight as a kid, and then again a few days ago about her incredible exploits in ORL even as hurricane winds howled outside, never fails to bring a lump to the throat.
"She who gallantly fought a man's battle, was our Queen of Jhansi".
One of the few positive side effects of Hurricane Sandy knocking out power for nearly a week was the rediscovery of a childhood joy of reading history books and stories of valiant Indian queens and kings by the candlelight. Globe-trotting dreams of kids in 1970s socialist India who couldn't afford to set foot on an airplane were kindled by reading and re-reading stories like Jules Verne's fascinating adventure travelogue 'Around the World in 80 Days', a book written a hundred years earlier in 1873.
Indian Rebel
Just a few years before Jules Verne wrote some of his most popular books, the English government was engaged in a bloody, all-out war for economic power in the Indian subcontinent. The rebellion against the colonizers in 19th century India was not just a local mutiny of Sepoys (hired soldiers), and not just an uprising of the peasants; native rulers (Rajas), dashing queens (Ranis), naturalized Indian kings of the dying Mughal dynasty, military leaders, intellectuals, priests, bankers, traders, farmers, ... entire populations participated in the struggle to free India socially, economically, and culturally in what came to be recorded as the first war of Indian Independence fought in 1857. This is one of the many excellent findings recorded in the historical book "Operation Red Lotus" written by Parag Tope, a descendent of Tatya Tope, chief coordinator of the Indian war machine during that time period.
Jules Verne's Captain Nemo of 1870 appears to be a character straight out of this war. A hi-tech sea-faring native prince seeking vengeance against the English, Nemo is not far from reality. Native rulers set up navies that relied on the construction of relatively sophisticated ships to safeguard overseas trade interests that were being overrun by the piracy of the English East India Company (EEIC). This is hardly surprising given that the world's first dockyard was built in India and the maritime prowess of native kings on both sides of the Indian coast is legendary. However, the key battles of the 1857 war were fought inland in Northern India.
Operation Red Lotus
A wealth of information from recently recovered original correspondence to Tatya Tope during this time period appears to have encouraged the writing of this book. This excellent review summarizes the findings. While there is ample evidence to suggest that the strategy and tactics employed by the Indian resistance in 1857 was indicative of a comprehensive and long-term approach, claims of an sustainable war effort cannot be taken seriously (to paraphrase Gen. Omar Bradley) unless it can be shown that there was a feasible logistics solution in place. Operation Red Lotus (ORL) answers this question in the affirmative.
pic source
The Lotus Code: Operations Research and Logistics?
ORL is mainly about how Tatya Tope and other leaders on the Indian side designed a simple and neat supply chain to support the war effort and maintain an army of newly unemployed native soldiers, bereft of any provisioning infrastructure. Tatya's first step, like we do in the corporate world today, was to forecast enterprise-level demand - but he had to do this without tipping off the Red Shirts. Toward this, he exploited the contempt the colonizers had for 'backward' Indian rituals and traditions. Tatya Tope secretively sampled demands at the platoon level using a red-lotus based numerical code. The English were puzzled to see a spate of red lotuses being passed around the garrisons in many cities they controlled and initially attributed it to yet another weird 'blood red' native custom. The number of petals in a red lotus is approximately the same as the number of soldiers in an EEIC platoon.

A native soldier who volunteered would pluck a petal and pass the flower on. After all soldiers made their choice, what was left of the flower was sent back to Tatya. By counting the reeds and/or the remaining petals in a returned lotus from a particular geographical location, noting the number of lotus-sampled platoons, and rolling up these estimates to a regimental level, Tatya was able to predict the approximate size of the native army by location. Having this fundamental information at hand, the planners calculated the provisioning required to sustain the war effort in its various stages, and also finalize the line of attack to capture and hold Delhi, the capital, as well as other strategically important cities. The next challenge was to geographically allocate supplies to satisfy this location-specific demand forecast given that the emerging native army did not have the resources or the time to rapidly create and manage their own own supply line. The only viable solution was to outsource this task, which was accomplished via the Chapati (an unleavened Indian bread) code.
The Chapati Code
After the flood of lotuses, the English were bemused to see Chapatis being exchanged by the chiefs of some villages. Alarm bells went off and they managed to intercept Chapatis embedded with lotus seeds.
The English concluded that this was not another strange custom and that the exchange of lotuses and Chapatis was some kind of a secret handshake. Red lotuses weren't found in the hands of villagers, and seeded Chapatis were not found in garrisons. What historians did not fully realize was that the lotus and the Chapati distribution were the code; not merely Boolean flags, but a vector representation of numerical information relating to troop strength and battle plans. We now know that the Indian war planners sent Chapatis to the various villages along a directional chain graph on a Euclidean plane whose source was a major garrison, and the sink was an important military objective.
The men of the villages that were ready to support the war effort would requisition and stock food grains, and the women of the village would be required to prepare food in quantities proportional to the number of Chapatis they received. The village chief would pass on a similar number of Chapatis to the next village in the designated chain. There is little doubt now that this was a coordinated and planned war to achieve self-rule.
Breaking Down The Supply Chain
When the time was ripe, the sepoys mutinied on the pretext of greased cartridges (immortalized by the legend of Mangal Pandey), catching the EEIC and the Victorian government in England off guard, and the initial phase of the war went against the colonizers. However, once they recognized the logistical method employed by the natives, the reprisals were eerily Nazi-like: swift, decisive and genocidal, and in keeping with a pattern that was repeated a few times before India's political independence in 1947. Villages on these chain graphs that supported the war effort were interdicted. Emergency laws were enacted that essentially gave English officers the license to kill civilians based on suspicion. Large populations, including women and children were wiped out, successfully disrupting the Indian supply chain.
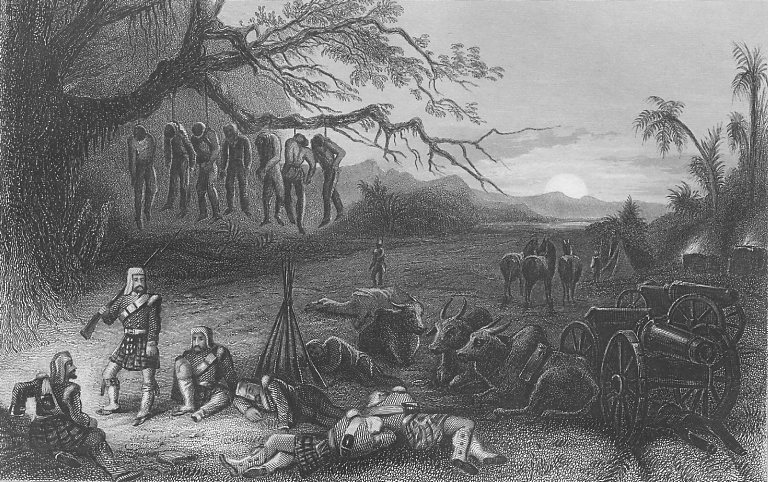
Once the logistical backbone was broken, it was a matter of time before the colonials won the war. However, it turns out that the war also had some cascading international effects.
Global impact of the 1857 Indian War of Independence
The London government withdrew huge sums of money from their banks and investments, including prominent financial institutions in the U.S, to raise sufficient capital to fund and ship out tens of thousands of fresh troops to India to win the war, while publicly spinning this fiasco as a localized case of mutiny. This behavior did not escape the attention of some Americans who questioned the official version.
.
ORL notes another pertinent question that George Train asked: "England says they are short of funds. Where are the hundreds of millions of silver that have been shipped there [India], disturbing the currency of the world?
The withdrawal of such huge sums of money by the English from US banks exacerbated the panic of 1857, and the resultant liquidity problem severely impacted the Northern states in the US besides triggering the world's first ever global economic crisis. Furthermore, the war hit the EEIC-pirated textile goods exported from India to the west, which reacted by sourcing more cotton from the southern US states that was being produced at even cheaper rates using African slave labor, thereby boosting the Confederate economy and morale. Thus, the Anglo-Indian war of 1857 appears to also have had some impact on the subsequent American civil war of 1861-65.
Jules Verne's Phineas Fogg is most likely based on George Train, a remarkable real-life American adventurer-entrepreneur who went around the world a few times, including a round trip in 67 days.
Legacy
It is less known that the Indian resistance achieved a few tangible victories for India in the long term. For brevity, we will have to leave that discussion for another day. India lost the 1857 war but those who resisted genocide became legend; none more so than the heroic young queen, Rani Lakshmi Bai. This coming Monday, November 19 is her birthday. Reading the immortal line in the Hindi poem about her in the candlelight as a kid, and then again a few days ago about her incredible exploits in ORL even as hurricane winds howled outside, never fails to bring a lump to the throat.
खूब लड़ी मर्दानी वह तो झाँसी वाली रानी थी।।
"She who gallantly fought a man's battle, was our Queen of Jhansi".
Sunday, October 28, 2012
Analytics and Cricket - IX : Book cricket v/s T20 cricket
Introduction
This previous post on cricket in this tab can be found here. We discovered how long a game of snakes and ladders is expected to last a while ago. Calculating the duration of a book-cricket game appears to be relatively simpler. It's a two-player game that used to be popular among kids in India and requires a book (preferably a thick one with strong binding), a pencil, and a sheet of paper for scoring. A player opens a random page, and notes down the last digit on the left (even numbered) page.

A page value of 'zero' indicates that the player is out, and an '8' indicates a single run (or a no-ball). The remaining possibilities in the sample space {2, 4, 6} are counted as runs scored off that 'ball'. A player keeps opening pages at random until they are out. Here's a sample inning from a simple simulation model of traditional book-cricket:
6, 2, 2, 1, 4, 4, 1, 2, 1, 2, 4, 2, 1, 4, 6, 6, 6, 4, 0
score is 58 off 19 balls
The counting process terminates when the first zero is encountered. Given this game structure, we try to answer two questions: What is the expected duration of a player's inning, and what the expected team total is (i.e., across 10 individual innings).
Conditional Probability Model
Assume a page is opened at random and the resultant page values are IID (uniform) random variables.
Let p(i) = probability of opening page with value i, where
p(i) = 0 if i is odd, and equals 0.2 otherwise.
D = E[Duration of a single inning]
S = E[Score accumulated over a single inning]
Conditioning on the value of the first page opened, and noting that the counting process resets for non-zero page values:
D = 1*0.2 + (1+D)*4 *0.2
⇒ D = 5.
Next, let us compute F, the E[score in a single delivery]:
F = 0.2*(0+2+4+6+1) = 2.6 runs per ball, which yields a healthy strike rate of 260 per 100 balls
S = FD = 13 runs per batsman, so we can expect a score of 130 runs in a traditional book-cricket team inning that lasts 50 balls on average.
Introduction of the Free-Hit
The International Cricket Conference (ICC) added a free-hit rule to limited overs cricket in 2007. To approximate this rule, we assume that a page ending in '8' results in a no-ball (one run bonus, like before) that also results in a 'free hit' the next delivery, so the player is not out even if the number of the next page opened ends in a zero. This change will make an innings last slightly longer, and the score, a little higher. Here's a sample inning (a long one):
1, 6, 1, 0, 1, 4, 2, 2, 4, 6, 1, 6, 2, 4, 2, 4, 6, 6, 6, 4, 1, 1, 6, 0,
score is 76 off 24 balls
Note that the batsman was "dismissed" of the 4th ball but cannot be ruled 'out' because it is a free-hit as a consequence of the previous delivery being a no-ball. All such free-hit balls are marked in bold above.
D = 1*0.2 + (1+D)*0.2 + (1+D)*0.2 + (1+D)*0.2 + (1+d)*0.2
= 1.0 + 0.6D + 0.2d
where d = E[duration|previous ball was a no-ball]. By conditioning on the current ball:
d = (1 + d)*prob{current ball and previous ball are no-balls} + (1+D)*prob{current ball is not a no ball but previous ball was a no ball)
= (1+d)*0.2 + (1+D) * 0.8
⇒ d = 1.25+D
⇒ D = 1 + 0.6D + 0.2(1.25+D)
⇒ D = 6.25
Under the free-hit rule, a team innings in book-cricket lasts 62.5 balls on average, which is 12.5 page turns more than the traditional format. A neat way to calculate S is based on the fact that the free-hit rule only increases the duration of an inning on average, but cannot alter the strike rate that is based on the IID page values, so S = 6.25 * 2.6 = 16.25. To confirm this, let us derive a value for S the hard way by conditioning on the various outcomes of the first page turn:
S = 0*0.2 + (S+2)*0.2 + (S+4)*0.2 + (S+6)*0.2 + (s+1)*0.2
= 2.6 +0.6S + 0.2s.
where s = E[score|current ball is a no-ball] and can be expressed by the following recurrence equation:
s = (1 + s)*prob{next ball is a no-ball} + (r+S)*prob{next ball is not a no-ball), where
r = E[score in next ball | next ball is not a no-ball]
= 0.25*(0 + 2 + 4 + 6) = 3
Substituting for r, we can now express s in terms of S:
s = (1+s)*0.2 + (3+S) * 0.8
⇒ S = 2.6 + 0.6S + 0.2(3.25+S) = 16.25, as before.
Under the free-hit rule, the average team total in book cricket is 162.5 runs (32.5 runs more than the total achieved in the traditional format). The average strike rate based on legal deliveries, i.e. excluding no-balls, is 162.5 * 100/(0.8*62.5) = 325 per 100 balls. A Java simulation program yielded the following results:
num trials is 10000000
average score per team innings is 162.422832
average balls per team innings is 62.477603
average legal balls per team innings is 49.981687
scoring rate per 100 legal balls is 324.9646855657353
Result: In comparison to real-life T20 cricket (~ 120 balls max per team inning), book-cricket is roughly 50% shorter in duration, but the higher batting strike rate usually yields bigger team totals in book cricket. The fact that we can even rationally compare statistics between these two formats says something about the nature of T20 cricket!
The cost of front-foot no-balls and big wides in T20
We can use the simple conditional probability ideas used to analyze book-cricket to estimate the expected cost of bowling a front-foot no-ball and wide balls in real-life T20 matches by replacing the book-cricket probability model with a more realistic one:
Assume p[0] = 0.25, p[1] = 0.45, p[2] = 0.15, p[3] = 0.05, p[4] = 0.05, p[5] ~ 0, p[6] = 0.05, p[7, 8, ...] ~ 0.
E[score in a ball] = 0 + 0.45 + 0.3 + 0.15 + 0.2 + 0.3 =1.4
This probability model yields a reasonable strike rate of 140 per 100 balls)
E[cost | no ball] = 1 + 1.4 + 1.4 = 3.8
Bowling a front-foot no-ball in T20 matches is almost as bad as giving away a boundary (apart from paying the opportunity cost of having almost no chance of getting a wicket due to the no-ball and the subsequent free-hit). Similarly,
E[cost | wide-ball down the leg-side] = (5|wide and four byes)*prob{4 byes} + (1| wide but no byes)*prob{no byes} + 1.4.
Assuming a 50% chance of conceding 4 byes, the expected cost is 4.4. On average, a bowler may be marginally better off bowling a potential boundary ball (e.g., bad length) than risk an overly leg-side line that can result in 5 wides and a re-bowl.
More sophisticated simulation models based on actual historical data can help analyze more realistic cricketing scenarios and support tactical decision making.
Tuesday, October 23, 2012
The Gaussian Hare, the Laplacian Tortoise, and Big Data
Alternative Optimal Solutions
A recurrent theme of this tab is to highlight an important contribution of O.R decision modeling: alerting us to the presence of alternative optimal solutions (AOS). Prior posts relating to AOS can be found here and here.
Customers unfamiliar or uncomfortable with the jagged-edged linear programming (LP) models often seek refuge within the smooth world of classical calculus (a world now known to have been initially crafted by Kerala mathematicians, but i digress). Here, alpine slopes of gracefully changing functions invariably allow you to rapidly ski down to a uniquely best solution. Like the truism "Football is a simple game; 22 men chase a ball for 90 minutes and at the end, the Germans win", an applied math legend is that the Gaussian hare invariably trumps the Laplacian tortoise. Unless of course, modern day optimization solvers and decision science come into play and allow Laplace to overcome the various complications posed by non-smoothness. (Image below linked from http://www.econ.uiuc.edu)

Degeneracy
Well specified decision models in a variety of industrial situations admit plenty of good quality answers, so the problem is usually one of having 'too many' rather than too few options (my favorite academic researchers tackle increasingly difficult unsolved problems, whereas my favorite OR practitioners compete on identifying the easiest unsolved problems). A fundamental thumb-rule of practical decision optimization modeling is to advantageously exploit and defuse this often-deadly problem of 'degeneracy' that characterizes practical LP formulations, and a reasonably skilled analyst can turn a potential numerical liability of the LP model into a business analytical asset as follows.
AOS often hide in plain sight
The presence of alternative answers forces us to revisit our translation of business rules into an LP and devote some time toward gainfully analyzing the differences in the potential business impact of these seemingly equal solutions. The customer can use this feedback to re-examine and further refine his/her business goals and priorities. This process of iteratively improving the design specification provides valuable insight to customers, and helps setup a richer, and a more practical and robust optimization model. Not that a similar exercise is impossible to accomplish using smooth approximations - just that the flexibility afforded by an LP model is often superior, and the tool kits for analyzing LP solutions have gotten amazingly better over the years.
Means and Ends
It just doesn't make sense to crunch through 21st century "Big Data" analytics using bleeding edge data mining, econometric, and machine learning methods on the one hand, and on the other hand, downgrade to 19th century techniques, or random black-box methods to manage the underlying decision optimization problems and produce severely suboptimal and non-robust solutions. Using such shortcuts because "a quick one-iteration improvement is all that is needed" brings along with some risky side effects and potentially leaves a big chunk of 'Big-Data' value on the table. Do everybody a favor and upgrade to a Laplacian tortoise (e.g. CPLEX) and you will be surprised to see how fast it runs, especially on Big Data.
A recurrent theme of this tab is to highlight an important contribution of O.R decision modeling: alerting us to the presence of alternative optimal solutions (AOS). Prior posts relating to AOS can be found here and here.
Customers unfamiliar or uncomfortable with the jagged-edged linear programming (LP) models often seek refuge within the smooth world of classical calculus (a world now known to have been initially crafted by Kerala mathematicians, but i digress). Here, alpine slopes of gracefully changing functions invariably allow you to rapidly ski down to a uniquely best solution. Like the truism "Football is a simple game; 22 men chase a ball for 90 minutes and at the end, the Germans win", an applied math legend is that the Gaussian hare invariably trumps the Laplacian tortoise. Unless of course, modern day optimization solvers and decision science come into play and allow Laplace to overcome the various complications posed by non-smoothness. (Image below linked from http://www.econ.uiuc.edu)
Degeneracy
Well specified decision models in a variety of industrial situations admit plenty of good quality answers, so the problem is usually one of having 'too many' rather than too few options (my favorite academic researchers tackle increasingly difficult unsolved problems, whereas my favorite OR practitioners compete on identifying the easiest unsolved problems). A fundamental thumb-rule of practical decision optimization modeling is to advantageously exploit and defuse this often-deadly problem of 'degeneracy' that characterizes practical LP formulations, and a reasonably skilled analyst can turn a potential numerical liability of the LP model into a business analytical asset as follows.
AOS often hide in plain sight
The presence of alternative answers forces us to revisit our translation of business rules into an LP and devote some time toward gainfully analyzing the differences in the potential business impact of these seemingly equal solutions. The customer can use this feedback to re-examine and further refine his/her business goals and priorities. This process of iteratively improving the design specification provides valuable insight to customers, and helps setup a richer, and a more practical and robust optimization model. Not that a similar exercise is impossible to accomplish using smooth approximations - just that the flexibility afforded by an LP model is often superior, and the tool kits for analyzing LP solutions have gotten amazingly better over the years.
Means and Ends
It just doesn't make sense to crunch through 21st century "Big Data" analytics using bleeding edge data mining, econometric, and machine learning methods on the one hand, and on the other hand, downgrade to 19th century techniques, or random black-box methods to manage the underlying decision optimization problems and produce severely suboptimal and non-robust solutions. Using such shortcuts because "a quick one-iteration improvement is all that is needed" brings along with some risky side effects and potentially leaves a big chunk of 'Big-Data' value on the table. Do everybody a favor and upgrade to a Laplacian tortoise (e.g. CPLEX) and you will be surprised to see how fast it runs, especially on Big Data.
Friday, October 12, 2012
Quoting an Optimal Price
Suppose you are an eBay-like online store operator selling wonderful home furniture sets made in Indonesia. For example a typical sofa set you sell may consist of a central offering in the form of a large three-person couch that is accompanied by a couple of matching chairs and tables (sample picture from an online wholesale dealer below).

While the center-piece tends to catch the eye of couch potatoes, you would like your customers to also buy the accessory pieces that go with this core product to boost your margin. To make this an attractive proposition, you recognize that every customer has a different willingness to pay and budget in mind. So rather than employ an inflexible fixed-price all-or-nothing approach, or risk a full-blown auction, you keep prospective buyers interested by allowing them to buy what they like and even quote their own price that you either accept or counter with a higher price. Unlike you, the buyer cannot see the price offers accepted and rejected in the past. How should you price a customer request taking all this information into account?
This scenario, as many would recognize, is not uncommon at all and plays out across multiple industries in the real and virtual world. Practitioners of Operations Research and Business Analytics creatively design a variety of probabilistic optimization models that allow a seller to provide a real-time price quote to a prospective buyer that maximizes the statistical chance of a profitable sale while staying within a customer's intended budget. Such mathematical bid-pricing methods help create a win-win situation by matching a customer's willingness-to pay with a seller's willingness to sell.
Where can you read more about such customized pricing models for bid response? A good start is the superb book on Pricing and Revenue Management by Robert Phillips or this pdf link. And if you are lucky enough to attend the Informs 2012 annual conference in Phoenix, AZ along with thousands of OR fans, a brilliant colleague of mine will be presenting a novel real-world instance not involving furniture, and talk about its tremendous business impact measured using non-monopoly currency. If real-life Integer Programming based probabilistic bid pricing can wake you up very very early in the morning, this talk is scheduled for 8 A.M, October 17.
Tuesday, October 9, 2012
Predicting the Future Size of the Nehru Dynasty
A glance through Indian newspapers will tell you about corruption in the highest places - specifically within India's so-called first family of Gandhis. Those not familiar with Indian politics would be surprised to find 'Gandhi' and 'corruption' in the same sentence. The puzzle is quickly resolved once you discover that this Gandhi family thankfully does not have the Mahatma in their family tree. This is the family of Nehrus, and at some point, a surviving daughter married a relatively unknown chap bearing that hallowed last name, engineering the most profitable branding coup the world has ever seen.
It is easy to write reams about how this family has institutionalized poverty and corruption in India over the last 60 years but it suffices for the purposes of this post to note that starting a few years prior to India's political independence from the British in 1947, members of the Nehru dynasty have directly or indirectly controlled (and destroyed) the futures of several hundred million Indians. Sadly, their level of incompetence has increased every generation, and as their numbers slowly grow, it becomes important for Indians to know this: how many dynasty members will a person have to get through to reclaim power in New Delhi in the future? Take a quick look at these time-series data in 20-year chunks:
Date Number Dynasty members
1924-1944: 0 No Nehru calling the shots
1944-1964: 1 Jawaharlal Nehru
1964-1984: 1 Indira Nehru Gandhi
1984-2004: 2 Rajiv Gandhi & Sonia Gandhi
2004-2014: 3 SoniaG, RahulG, & PriyankaG
----------------------------------------------------------------
2014-2024: 3 SoniaG, RahulG, & PriyankaG
2024-2044: 5 SG, RG, PG and PG's two children
The numbers below the dashed line are future predictions based on the current family count, and assuming that Priyanka's two kids today (Rahul is unmarried with no pending paternity cases) will be baptized into the family tradition of absolute power in their 20s-30s, like every generation before them.
Of course, it should not be surprising that the counts shown above are exactly the first six numbers of the Fibonacci sequence. There is another interesting case of poetic injustice in the nomenclature that is hidden here. Calling them Fibonacci numbers perpetuates an injustice to the mathematicians in India who discovered the series a long time before Fibonacci and unlike the Gandhi-Nehru mix up, this fact was well-known outside India too.
Thursday, September 27, 2012
Optimizing Your Airport Baggage Claim Experience
You rub your weary eyes and get off that Airbus 380 to signal the end of your long 16-hour flight and wearily make your way to the baggage claim. You patiently wait along with your family to pick up your 4-6 pieces of check-in luggage before proceeding through the customs and immigration checks. It's a tiresome and time consuming process. Is there a way you can make things better for yourself? Perhaps...
Decision Problem
What is the most strategic location along the snake-like baggage claim conveyor belt to position oneself?
First, here's a sample picture of the baggage claim area (in the new Bangalore International Airport in India. source: inmagine.com)

Data
The one in the picture above looks like a standard belt with a single 'U' bend. To support passengers disembarking from an A-380, perhaps a longer belt having more than one 'U' may be required. Let us label each element of data we come across. Most of the data that we sift through below may not be needed, but it may be handy for other related analysis in the future.
As a first approximation, we simplify the topography by stretching out the belt in a straight line along one dimension. We thus have a simple chain-link graph having a single origin ('o') and destination node ('d'), and total o-d path length 'L'. Furthermore, 'd' is reconnected back to 'o' to create a cyclical network (and a circulation system, and a queuing system, and a multicommodity flow network). Let the average length of each bag be 'w'. We assume that the bags move at a constant velocity 'v', even though the value of 'v' itself may drop if the belt is heavily loaded (e.g. v = 0, if somebody checked in an elephant). Let the total supply (inventory) of bags that is to be circulated through the conveyor belt be 'N'. For simplicity, we assume that each passenger has checked in one bag and line up along the belt to pick up their bag if they manage to ID it in a timely manner. Flow through this simple network stops after a certain number of cycles have been completed (we could ignore this rule for simplicity), or after the inventory is depleted to zero, whichever occurs first. We assume that the supply at 'o' is replenished periodically as the baggage trucks roll in, every 'k' cycles, until all inventory has been offloaded.
Analysis
The number of bags displayable on the belt at any time is bounded by n = L/w, where typically n << N. The density (defined as bags per unit length) is a non-increasing function of the distance from 'o' at all times, since bags can only be removed from the belt between 'o' and 'd'. In other words, the 'n' bags are not distributed uniformly, and the density is maximum near 'o', and at a minimum near 'd'. A person nearest 'o' will have to scan a lot more bags on the average before a successful match - and due to the recycling of unmatched supply, he may end up scanning some bags more than once. (Perhaps the expected number of scans can be calculated using the above data, but I suspect simulation may be an easier alternative.) On the other hand, the person waiting nearest 'd' has the least amount of work to do, since every successful match upstream means one less failed scan for her. In the extreme case, if every other passenger correctly identified their own bag the first time they see it, the person at 'd' would have to do zero work. The first bag that would show up in front of her would be hers and she can simply pick it up.
Recommendation
If the objective is to least strain your already tired eyes, perhaps it's best that you wait near 'd'.
However, we often see people get off a plane and head right for 'o'. From a safety perspective, the bags belonging to people waiting near 'o' are likely to traverse the belt the least, minimizing the chances of a bag being mistakenly matched or stolen. From a security perspective, waiting near 'o' makes sense. It seems some airports now check luggage tags before allowing a passenger to exit the baggage claim area, so this safety objective may not be useful for long. There are other obvious considerations such as picking a spot that is least crowded. If we assume that the probability 'p' that a passenger identifies their own bag in a timely manner is inversely related to the passenger density in their neighborhood and bag density, a primary consideration may be to just find a sparsely populated spot. Among such sparse spots, the one closer to 'd' may be a better option. On the other hand, the expected benefit from such a policy diminishes if too many passengers choose to be close to 'd', resulting in congestion. Finally, the state of the system changes over time. As the inventory depletes and passengers randomly exit the system, it may be worth relocating if you have the energy to do it.
All this stuff is useful provided your airline has not misplaced your bags in the first place.
Thursday, September 20, 2012
FDI in Indian Retail: Good or Bad for India? In 100 Words or Less
Is building a hospital in an Indian town good? sure
If congress workers construct it? no.
Building a road generally a good idea? yes.
If the congress party supervises? nope.
Whether 'FDI* in retail' is bad or good strategy for India is moot. If its execution is mangled, it will end up being a horrific loss. A 60+ year trail of evidence supports this indictment of the Congress party.
"Amateurs Talk about Strategy, Dilettantes Talk about Tactics, and Professionals Talk about Logistics". The original quote is usually attributed to General Omar. Bradley, the "People's General".
(FDI = Foreign Direct Investment. 'FDI in Retail' may well be the proverbial straw the breaks the ruling Congress party's back.)
Tuesday, September 4, 2012
Visiting the Land of the Ramayana
India is timeless. Returning from there is always the difficult part and every trip to the land of the Ramayana and the Mahabharata invariably feels too short, and the most recent visit to South India was no exception.
India frustrates. Six decades of Soviet-style centralized planning after two centuries of looting by the British has wrecked the post-independence economy and sapped much of it's optimism. Economic liberalization introduced in the 1990s to rescue the economy has now slowed down. India is living proof that populist socialism works wonderfully in theory, but in practice brutally extinguishes the hopes and lives of millions. I have had first hand experience. India's first and foremost modern ORMS and analytics practitioner, P. C. Mahalanobis constructed large-scale linear programming models in the 1950s to optimize such grand centralized planning goals - an exercise in futility and certainly not the science and practice of 'better'!
 (pic source: www.famousscientists.org)
Incidentally, one of the members of today's NAC (national advisory council), an unaccountable group of secretive leftist planners that work totally outside the purview of the Indian parliament, is Jean Dreze, a naturalized Indian citizen from Belgium who appears to have learned the art of coming up with equally grand centralized planning models (for the 21st century) from his father, who was both an operations researcher and economist. Not surprisingly, these grand schemes have failed miserably during human testing. It seems the modeling assumptions did not account for reality.
Mahalanobis did however leave behind a positive legacy. He founded the Indian Statistical Institute that produces many smart ORMS and statistics graduates to this day. He was a contemporary of the legendary Srinivasa Ramanujan and there is a well-recorded story of PCM posing a math problem to the young math genius from Tamil Nadu, who while cooking, answered the question and also provided a solution to the more general case.
Perhaps a major reason why India still has above-average GDP growth is the natural entrepreneurial spirit of its talented people that simply refuses to die. There is a market for everything in India.
India enchants. By the time I wake up in the morning in my ancestral village in the temple state of Tamil Nadu, my mother has created her Kolam (Rangoli) patterns in front of the house.
 (pic source: /farm3.staticflickr.com)
In the old days, the designs were done using rice flour, so the little ants could feed on it. According to Indian belief, all living creatures, big or small, have souls just like humans. I doubt if my mother bothered to check if the Kolam path she traced every morning for the last 40 years was a Hamiltonian circuit or not ...
 (pic source: 3.bp.blogspot.com)
India challenges. We board a train from Bangalore to Chennai. The seats are numbered sequentially but the ticket does not provide a deterministic clue on whether we have an aisle or middle seat. My family has contiguous seat numbers, but we soon discover that the seats themselves are not. A sole traveler shifting away from his window seat would have solved the problem in a jiffy but he refuses to oblige. We discover two other families facing the same problem. We perform an elegant three-way swap that would have made Lin and Kernighan proud, and enjoy a global optimal solution to this combinatorial problem for the remainder of the journey. It's about time the Indian Railways switches to alphanumeric seat labels.
India corrupts. I notice the beginnings of a flyover (overpass) in my village-town. Clearly there doesn't seem to be a need for it since the benefit/cost ratio seemed rather poor, but the politicians wanted one, so the town has to endure it. They're also widening the train tracks that go thru the town, which actually appears to be a sane idea. However, they want to rebuild a working bridge to accommodate this change. The crazy guys try to demolish the old bridge, but it proves to be too strong, so work is delayed. Eventually the new one will come up and will most likely be built with sub-standard building material.
India heals. I visit the temple of my Ishta Devta (approximately translates to: 'preferred iconic embodiment of the divine') that is located on a hill in Pazhani,Tamil Nadu. In the past, many fervently monotheist invaders of India mistook this sophisticated Indian concept for "idol worship", leading to genocide and wholesale temple destruction. sigh.
 (pic source: upload.wikimedia.org)
I visit this famous temple the traditional way by climbing the many hundred steps to the summit. It's also a great morning work out. My family choose the popular modern mode of transportation and take the cable-car and arrive 30 minutes later! There appears to be a classical circulation problem hidden there.
 (pic source: commondatastorage.googleapis.com)
The temple staff appear to be practicing some form of revenue management while also maximizing cable car capacity utilization. Uphill rides are twice as expensive as riding down, off-peak rides are half-price, and they wait until the cars are at capacity before launching. Hence the delay. Once inside the temple complex on the top, the administrators appear to employ 'lot sizing' where people line up and then ushered in to view the Murthi (icon) of the deity in batches that seem to be somewhat synchronized with cable car arrivals at the top. Thus I derive no significant advantage in getting to the top earlier than the cable-car riders. You either wait at the bottom of the hill or on top and the total time spent in the system is practically constant.
India beckons. All said and done, I cant wait to get back. Until then, here's an audio sample of South Indian classical (Carnatic) vocal synced to Western instrumental music.
India frustrates. Six decades of Soviet-style centralized planning after two centuries of looting by the British has wrecked the post-independence economy and sapped much of it's optimism. Economic liberalization introduced in the 1990s to rescue the economy has now slowed down. India is living proof that populist socialism works wonderfully in theory, but in practice brutally extinguishes the hopes and lives of millions. I have had first hand experience. India's first and foremost modern ORMS and analytics practitioner, P. C. Mahalanobis constructed large-scale linear programming models in the 1950s to optimize such grand centralized planning goals - an exercise in futility and certainly not the science and practice of 'better'!
Incidentally, one of the members of today's NAC (national advisory council), an unaccountable group of secretive leftist planners that work totally outside the purview of the Indian parliament, is Jean Dreze, a naturalized Indian citizen from Belgium who appears to have learned the art of coming up with equally grand centralized planning models (for the 21st century) from his father, who was both an operations researcher and economist. Not surprisingly, these grand schemes have failed miserably during human testing. It seems the modeling assumptions did not account for reality.
Mahalanobis did however leave behind a positive legacy. He founded the Indian Statistical Institute that produces many smart ORMS and statistics graduates to this day. He was a contemporary of the legendary Srinivasa Ramanujan and there is a well-recorded story of PCM posing a math problem to the young math genius from Tamil Nadu, who while cooking, answered the question and also provided a solution to the more general case.
Perhaps a major reason why India still has above-average GDP growth is the natural entrepreneurial spirit of its talented people that simply refuses to die. There is a market for everything in India.
India enchants. By the time I wake up in the morning in my ancestral village in the temple state of Tamil Nadu, my mother has created her Kolam (Rangoli) patterns in front of the house.

In the old days, the designs were done using rice flour, so the little ants could feed on it. According to Indian belief, all living creatures, big or small, have souls just like humans. I doubt if my mother bothered to check if the Kolam path she traced every morning for the last 40 years was a Hamiltonian circuit or not ...

India challenges. We board a train from Bangalore to Chennai. The seats are numbered sequentially but the ticket does not provide a deterministic clue on whether we have an aisle or middle seat. My family has contiguous seat numbers, but we soon discover that the seats themselves are not. A sole traveler shifting away from his window seat would have solved the problem in a jiffy but he refuses to oblige. We discover two other families facing the same problem. We perform an elegant three-way swap that would have made Lin and Kernighan proud, and enjoy a global optimal solution to this combinatorial problem for the remainder of the journey. It's about time the Indian Railways switches to alphanumeric seat labels.
India corrupts. I notice the beginnings of a flyover (overpass) in my village-town. Clearly there doesn't seem to be a need for it since the benefit/cost ratio seemed rather poor, but the politicians wanted one, so the town has to endure it. They're also widening the train tracks that go thru the town, which actually appears to be a sane idea. However, they want to rebuild a working bridge to accommodate this change. The crazy guys try to demolish the old bridge, but it proves to be too strong, so work is delayed. Eventually the new one will come up and will most likely be built with sub-standard building material.
India heals. I visit the temple of my Ishta Devta (approximately translates to: 'preferred iconic embodiment of the divine') that is located on a hill in Pazhani,Tamil Nadu. In the past, many fervently monotheist invaders of India mistook this sophisticated Indian concept for "idol worship", leading to genocide and wholesale temple destruction. sigh.
I visit this famous temple the traditional way by climbing the many hundred steps to the summit. It's also a great morning work out. My family choose the popular modern mode of transportation and take the cable-car and arrive 30 minutes later! There appears to be a classical circulation problem hidden there.
The temple staff appear to be practicing some form of revenue management while also maximizing cable car capacity utilization. Uphill rides are twice as expensive as riding down, off-peak rides are half-price, and they wait until the cars are at capacity before launching. Hence the delay. Once inside the temple complex on the top, the administrators appear to employ 'lot sizing' where people line up and then ushered in to view the Murthi (icon) of the deity in batches that seem to be somewhat synchronized with cable car arrivals at the top. Thus I derive no significant advantage in getting to the top earlier than the cable-car riders. You either wait at the bottom of the hill or on top and the total time spent in the system is practically constant.
India beckons. All said and done, I cant wait to get back. Until then, here's an audio sample of South Indian classical (Carnatic) vocal synced to Western instrumental music.
Subscribe to:
Posts (Atom)