Showing posts with label ISI. Show all posts

Sunday, June 16, 2013

Traveling Surveyor: Contributions of Mahalanobis to Analytics - 2

Bengal
This post is the second in a series of blogs based on the work done by P. C. Mahalanobis in the area of statistics, analytics, and operations research between 1930-1960. We move north-east from the location of our prior post on storm-flood forecasting (Orissa) to Bengal: a land of science, wisdom, and dharma that gave to the world a Vivekananda whose thoughts deeply affected Gandhi's contribution to India's freedom struggle, who in turn shaped the work of Martin Luther King, Jr., and Nelson Mandela, and thus the civil liberties of a significant population of the world.

Much of discussion here is gleaned from ISI archives, websites, and various papers from Sankhya, ISI's flagship journal. Those interested in a more detailed and accurate analysis of this work are referred directly to ISI's journal material.

Jute
Bengal (including Bangladesh, formerly East Bengal) produces much of the world's jute. India is the largest producer and consumer of Jute today, followed by Bangladesh. Jute is an incredibly useful crop and has been a significant contributor to Bengal's revenue for a long time.  Here are some contemporary pictures of standing Jute crop in Bengal.


(pics source: informedfarmers.com)

Why this work is important
Prior to 1947, when India was still occupied by the British Raj (there's a very relevant reason for bringing this up, but we'll get to that later), forecasting the supply of this valuable and lucrative crop in Bengal was largely a product of bad guesswork. Like most other sectors in India, the agricultural sector too is highly decentralized, which means a myriad of tiny farms growing jute and other crops, all of which had to be surveyed if one wanted to get an exact, enumerated production number. Mahalanobis came up with an alternative in the 1930-40s using methods derived from statistics and a field that is now termed 'Operations Research': a scarce-resource optimized method for accurate crop forecasting. Today, the Government of India employs sophisticated remote sensing including a Satellite Survey System to improve crop forecasts, but the methods developed then are still relevant and valuable. The seminal work of Mahalanobis in developing an optimal sample-based survey is also interesting to read from a practitioner's perspective. The combination of ideas employed in the work done in the 1930s include data analysis, statistical modeling, pilot study, scarce resource allocation, and mathematical optimization, and ranks among the great achievements in the practice of Operations Research and Analytics.

A map of undivided Bengal, circa 1850 C. E. (source: http://jrahman.files.wordpress.com)

Motivation
Jute and cotton were two of the most important exports out of India after the manufacturing sectors was crippled by the British Raj - 24% of the total revenue between 1927-37 was from Jute. Estimating the total Jute produce in Bengal up until the 1940s was largely a product of guesswork and ad-hoc estimates provided by the administrative chain of the British Raj produced wildly varying numbers. Like other parts of India, cultivation in Bengal was decentralized and spread over nearly 100 Million small farms, which were on average less than half-an-acre in area, spread over more than 60, 000 sq. miles. Jute was grown in a subset of these farms. Furthermore, the cultivation lifecycle of Jute is very short - about two months from planting to harvesting. Consequently, even if the administration was willing to cough up the expenses for an enumeration survey, covering all these farms within 8-9 weeks would be extremely expensive, if not impossible. Add to the fact, that many plots (30%) that cultivated Jute also cultivated other crops in parallel. Thus, while in theory, we can expect a total enumeration to give us near-zero error, in practice, allotting multi-crop areas to Jute and other Human-induced errors would introduce noise. In fact, the report states that the biggest negative associated with an enumerative survey was not the prohibitive cost but its unreliability, and this motivated Mahalanobis to develop and implement an alternative approach that accomplished the task at a fraction of the cost and time, and at a higher level of accuracy using random sampling.

Random Sampling
The nearly 100M jute farms were spread over Bengal in a non-homogeneous manner. Some areas were densely cultivated, some sparsely. The approach was to partition the total area into zones, i = 1, ..., n (area A_i) whose area was internally homogeneous (kinda like the way finite element analysis is used in structural engineering). Within each zone, a number of areas or grids were selected and sampled at random. If a sufficient number of such grids were sampled, the average proportion of area under Jute within a zone (J_i) can be obtained, which allows us to predict the total area under Jute  = sum(i) A_i * J_i.

Decision variables
1. The partition of the total area into approximately homogeneous zones
2. The number of random samples within a zone
3. The area of a sample

For simplicity, we assume that the first decision of partitioning the area within Bengal is an external input and thus our focus is on optimizing the remaining two decisions.

Constraints
1. The cost of the whole operation depends on the second and third set of decision variables.  For a given budget, if the area of an individual sample is large, then the number of samples has to be reduced, and thus the samples would be more spread out and further away from each other.

2. The achievable precision (variance) varies similarly. If the sample area is large, the per-sample variance is smaller, but cost considerations limited the number of such large-samples, and this can hurt the overall variance accumulated across the zone. On the other hand, a smaller area in tandem with a larger number of such small-samples affects precision in an opposite manner.

Nonlinear Optimization Problem
Given either cost or precision as a hard constraint, select the sampling area and the number of random samples to maximize precision, or minimize cost.

Mahalanobis' approach attempts to model the change in variance and cost as continuous functions of the two decision variable sets. Once these functions are at hand, a local optimum is obtained using a derivative based Lagrange-multiplier method. Mahalanobis used this approach to tabulate the achievable precision for a range of cost levels.

An exploratory, small-scale (pilot) survey was initially conducted at a small expense as a proof-of-concept and proof-of-technology validation of the methodology prior to embarking on a full-scale project. This type of an approach is now widely adopted in many business analytics projects.

The effect of the decision variables on variance can be calculated relying on theoretical methods. However, human-induced errors were also common, and Mahalanobis used the idea of interpenetrating half-sample pairs, where two groups independently arrived at Jute area estimates for a given location.  There are many important details here that are left out for brevity. The cost calculation is detailed and empirical and depends on the nature of the survey, and among things, include:
a. cost of staying and surveying at a given site - this depends on the size of the sampled area and time spent
b. cost of traveling from sample to sample - this depends on the distances between the chosen samples and the sequence of visiting.

Again, we have left out a humongous amount of cost calculations that were done. Reading the reports that came out of this work, one is amazed by the time and effort devoted to meticulously tabulating the various costs that go beyond 'ball-park' estimates, to produce an accurate cost function. For example cost calculation (b) depends on the solution to the corresponding traveling salesman problem.

The TSP
One of the many reports that came out of this this project notes:
(source: Sankhya journal, 1940)

This cost calculation is reviewed by Applegate, Bixby, et al. in their book on TSP and in Bill Cook's 'In Pursuit of the Traveling Salesman'.  A literature review of this TSP in these books mention that researchers later showed that the expected length of the optimal tour was approximately between (0.707, 1.27) times the square root of the number of samples visited in a unit square, so Mahalanobis' 1930s estimate was a remarkably good choice.

Results and Business Impact
The cost- and precision-controlled random sampling approach proved to be revolutionary. It achieved greater precision at a fraction of the cost.  Specifically, the margin of error was +/- 2%, and the cost was 1/15 of an enumeration census that was performed the same year and found to be less accurate compared to the random sampling approach. Thus the benefit and return-on-investment of this analytical approach was successfully demonstrated in practice, which received widespread recognition and was later embraced by the Government of independent India for many nationwide surveys.

Prelude to Part-3: The Bengal Holocaust
Within a couple years of the successful demonstration and publication of this work, Mahalanobis' Bengal lost between 2-6 million people due to starvation and disease between 1942-1945, triggered in part possibly by a failure of rice crop. The British Raj, locked in an grim Atlantic battle during WW2, may have suppressed reports and figures. It appears that most of the world, and even a vast majority of Indians, to this day, remain unaware of the reality behind this event.  How to obtain a reasonable estimate of casualties due to this disaster? Who was responsible and how? A recent book has brought this controversy into the open, and it appears that Mahalanobis (and his statistical sampling method) may have played a critical part in solving this puzzle.

To be continued.

Monday, June 10, 2013

Storm Chaser: Contributions of Mahalanobis to Analytics - 1

Introduction
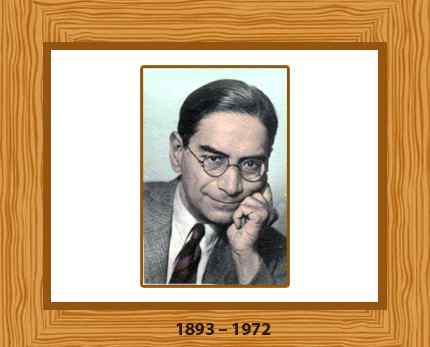
The recent history of the practice of Analytics and Operations Research in India appears to begin with P. C. Mahalanobis; or at the very least, he is central to this history during the 1930s-1960s time frame.
(source: www.isical.ac.in)

Aside from the well-known Indian Statistical Institute in Kolkata and the distance measure named after him, his legacy includes a rich body of practical analytics work. Examples includes the design of a cost-effective and accurate random sampling method to determine the jute crop output in Bengal in the 1930s,  predictive analysis of the effects of South-west monsoons in the Indian state of Odisha (Orissa), a post-mortem of the Bengal famine in the 1940s, and his application of Linear Programming models for national planning in the 1950s. As an ORMS practitioner as well as a student of Indian history, these works are quite useful and instructive and will be covered here over the next few weeks, starting with his analysis of monsoon storms in Odisha. This is the second post here associated with this beautiful state of India. A previous post on Odisha analyzed the optimal location of elephants ('jumbo decision variables'), no kidding.

Storm Chaser
Figure 1 below depicts an annotated Google map of the area of the catchment basin for the Mahanadi ('great river') near the east coast of India and the river delta where the Mahanadi and other rivers (including the Brahmini and Baitarini) deposit their alluvial silt and empty into the Bay of the Bengal.

(Figures 1 and 2: google maps)

Mahalanobis' description of this problem in the 1930s issue of Sankya, ISI's journal, begins with a general description of the geography and the climate of this area that provides us a big picture and context for his research, before utilizing weather-related data for a deep-dive analysis. Data indicates that the south west Monsoon (June-September) accounts for around 80% of the total rainfall in the year in the bay area, and can result in severe flooding in certain areas resulting in loss of life and property. In particular, the research focuses on the head of the delta ("A": Naraj, near the city of Cuttack), depicted using a zoom-in on the area.

To the of south of this area lies the magnificent Chilka lake, the second largest lagoon in the world.
(source: flikr)

Mahalanobis' description really brings to life a bunch of dry and dull row-and-column data by mapping it to visceral reality. You can almost feel the intensity of the monsoons, and see the storm waters rushing by. This makes the subsequent description of the analytical approach that much more easier to follow and enjoyable to read - something sorely missing in almost all technical journals today.

Weather data recorded during previous monsoons (between 1874-1926) indicate that such storms originate from the Bay of Bengal and move westward over a period of a few days. A table of calculated effective distances between the various locations of interest in the Mahanadi system is given below. Each row is associated with a location that is further east of the coastline.


(source: Sankhya journal)
The accumulated run-off water in the catchment basin (51, 000 Sq. miles) enter the river system and much of it flows through Naraj before exiting into the Bay. In the absence of any weather satellite data, the objective of the exercise is to analytically determine the time period where key flood-prone locations of the Bay area will be threatened by a big storm that makes landfall, and if timely warnings are feasible.

Step 1: Storm Velocity (east-to-west)
Existing historical data tracks the location of the center of storms in the past. Using this data, Mahalanobis estimated an average speed of a typical storm at 8.5 MPH. Next, he made a neat assumption: The velocity of the center of the storm must be roughly the same as the velocity of the locus of heavy rainfall that first falls in the delta area and takes about 40 hours to reach the eastern most section (V). He then used rain gauge data recorded at various points in the catchment area to note the period of peak rainfall to obtain the temporal lags between the rainfall peaks at various locations to independently confirm this estimate. Nice! Mahalanobis was now able to predict the approximate times of peak rainfall at various locations. Figure 3 below shows a snapshot of these results for the Mahanadi catchment area. Note the proximity of the delta to the bay (~50 miles).


(figure source: Sankhya journal)
The next step was to correlate this information with the resultant flow characteristics of storm water run-off back into the bay of Bengal.

Step 2: Flood Velocity (west-to-east)
Mahalanobis performed a series of calculations to estimate the typical historical velocity of the flood waters (in the absence of any gradient information) by correlating the times and locations of peak rainfall with the peak water level data recorded using a flood gauge of Naraj. Again, a cool use of lags. As before, he employed two independent methods to compute a reliable value, which turned out to be fairly steady at around 4 MPH most of the way, and slowing down at the head of the delta (section-I) where the land considerably flattens out.

(figure source: Sankhya journal)

The picture is now complete. Mahalanobis summarized his findings as follows:

Unfortunately, casualties due to flooding remains a serious problem here (2011 report) to this day. A youtube video of flood waters at Naraj, 2011, and another one in 2008.


Updated June 10: (pic source: http://censusindia.gov.in)


Wednesday, June 5, 2013

Left-handed Coconut Trees and Other Statistical Tales

Lots of more interesting stuff in C. R. Rao's 1989 lecture. I blogged about a historically interesting demand estimation problem from this talk earlier today. I'm sharing other comments below. Italicized words are mine.

On the philosopher's view of knowledge.
...Vivekananda and Einstein maintained that new knowledge can be created only by instinct, reason and inspiration, a process known as abduction and not by deductive reasoning assuming a given set of premises to be true or by inductive inference from observed data. ( “a theory can be proved by an experiment, but no path leads from experiment to theory”-Einstein).

The ancient Hindu scriptures mention, perception (pratyksha), inference (anumana), comparison (upamana) and verbal testimony (sabda) as possible instruments for creation of new knowledge.

From a subsection on the scientist's view of knowledge
"In May 1983, exactly 350 years after Galileo‟s confession, Pope John Paul II graciously conceded to a delegation of 200 scientists that the Pope Urban VIII who convicted Galileo might have erred. In July 1984, after examining all the relevant documents, Pope Paul II exonerated Galileo saying that the judges who condemned Galileo were wrong."

On Serendipity in scientific discoveries
"Pluto's moon Charon was discovered by US astronomer James Christy in 1978. He was going to discard what he thought was a defective photographic plate of Pluto, when his Star Scan machine broke down. While it was being repaired he had time to study the plate again and discovered others in the archives with the same "defect" (a bulge in the planet's image which was actually a large moon)."
One person's discarded 'outlier' is another person's treasure.

On statistics and scientific research.
... As R.A.Fisher said in a speech delivered at the Indian Statistical Institute in 1952: “Statistical science is the peculiar aspect of human progress which gave 20th
century its special character. It is to the statistician the present age turns for
what is most essential in all its more important activities”."
perhaps he meant to say 'Operations Research'. maybe not.

R.A.Fisher. Emphasizing the need for consulting a statistician before the experiment is conducted, Fisher said:
“You get 10 times more information from a carefully designed experiment. To consult a statistician after the experiment is finished is often to merely ask him to conduct a postmortem examination. He can only say what the experiment died of”.

“Statistics is the technology of finding the invisible and measuring the immeasurable”.

On statistical applications.
"....Galton was able to collect birth order data from 99 of his [gifted, accomplished] subjects, revealing that 48% of them were first born sons or only sons. The percentages of the second and third born were very low..."
Rao mentions he was his parent's eighth child.

...T.A. Davis, a professor at the Indian Statistical Institute made several studies on coconut trees which can be classified as left-handed or right- handed depending on the direction of its foliar spiral. By doing experiments he found that spirality is not genetically inherited and left handed trees yield 10% more coconuts than the right handed trees, a conclusion of economic importance. A recommendation was made to the Government in the state of Kerala to grow only the” leftists to increase the production of nuts”.
Possible context: Kerala was crazy enough to willfully usher in the world's first democratically elected communist government.

On facts before theory:
“It is a capital mistake to theorize before one has data. Insensibly, one begins to twist facts to suit theories instead of theories to suit facts.
- Sherlock Holmes

Without good information, you won‟t see things as they really are-you will see them as you think they are.
“Aristotle maintained that women have fewer teeth than men; although he was married twice, it never occurred to him to verify his statement by examining his wives ‟mouth”.
- Bertrand Russel

On decision making under uncertainty, an important area of ORMS.
“The need for knowing the three R’s, reading, writing and arithmetic, is well understood. These do not take us far unless we acquire the fourth R, reasoning under uncertainty, for taking decisions in real life”.
-C.R.Rao (Statistics and Truth)

Rao finishes with this.
The philosopher Sullivan, when asked whether he believes in astrology, replied.
“I am a Gemini and Gemini do not believe in astrology”.
Thank you.

updated: June 6, typos.

Estimating the Number of Refugees inside the Red Fort, 1947

An interesting historical use of statistical thinking during a humanitarian crisis. The situation is as follows:

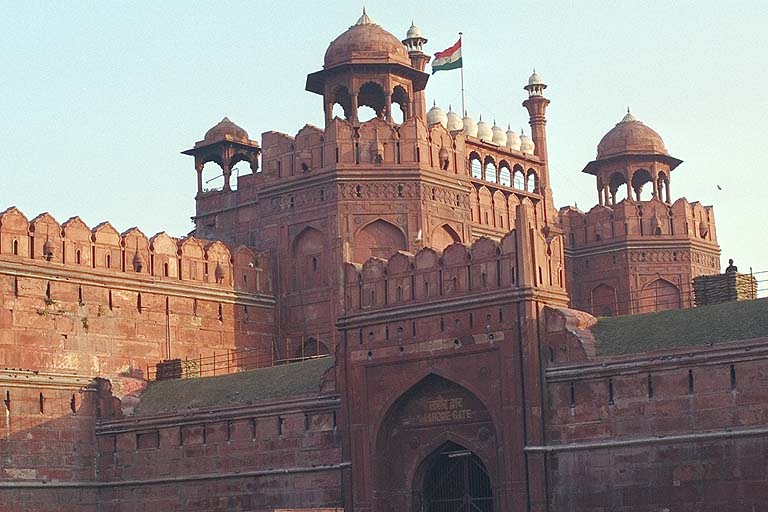
Britain decided to up and leave India one fine day, but not before partitioning the land into the Islamic state of Pakistan, and Gandhi's pluralistic India. Communal riots broke out in 1946-47 during the biggest cross-border exodus of populations in mankind at that point in time. In Delhi, the capital city, an unknown number of (the majority of the) Muslims who chose to remain in India arrived to seek shelter in the iconic red fort and also within the smaller area of Humayun's tomb. The rest of the situation is described by C. R. Rao, professor emeritus at Penn State, and ranked among the greatest living statisticians, in his 1989 lecture (emphasis and comments in parantheses added by me):"

"...The government employed contractors to feed them. The contractors used to submit bills to the government of the purchases they made of different commodities [that were in short supply] like rice, pulses, salt etc. , to feed the refugees. A Secretary to the government of India suspected that the contractors were over quoting the commodities they purchased and he thought of asking a statistician to go inside the Redfort and count the number of refugees. Perhaps there were no statisticians in Delhi at that time, he sent a telegram to the Indian Statistical Institute in Calcutta requesting for a statistician to be sent to Delhi immediately. Two statisticians who had experience in conducting sample surveys went to Delhi by air and on arrival they were taken to the Redfort. 

When they wanted to go inside the Redfort to see how they can count, the guards did not allow them to go inside as they were not members of the same community as the refugees. The problem then was to estimate the number of refugees without going inside the fort or having any  knowledge of the concentration of refugees inside the Fort. The experts had conducted household surveys in Calcutta and had some idea of per capita consumption of different commodities. Here statistical thinking came to their rescue. If R, P, and S are the amounts quoted by the contractors of rice, pulses and salt, and r, p, and s are the per capita consumptions of these commodities as estimated from household surveys, they argued that R/r, P/p and S/s are estimates of the same number of persons. Based on the figures quoted by the contractors, the three estimates based on rice, pulses and salt were, 30,253, 21,122, and 10,891 respectively. They chose the smallest number based on salt. Rice was the most expensive commodity at that time and apparently the contractors were over quoting the amount of rice purchased to make money. There was another protected area, the Humayun Tomb where [a smaller number] some have taken refuge. A volunteer belonging to the same community as the refugees entered the tomb and counted the number of refugees; The statisticians used the same formula there and found that the salt estimate agreed with the number counted. The government secretary was pleased and accepted the salt estimate..."
(pic source: wikimedia)

C. R. Rao was one of the early members of the renowned Indian Statistical Institute (ISI) that was founded by the legendary P. C. Mahalanobis, an institute the produces fine Operations Research grads to this day. He's briefly mentioned in an earlier post, and an upcoming post in this space will again be related to his work.

Historical Postscript
1. A story that involves covert sampling to predict the number of pro-India soldiers to provision during the 1857 war of independence in India is briefly covered in 'Operation Red Lotus'.


(pic source: http://whc.unesco.org)
2. The tomb, which was visited by President Barack Obama on his India visit, houses the mutilated remains of a so much more relevant person - Dara Sikoh, perhaps the Mughal who most deserved the suffix "great". The Red Fort (and the Taj Mahal) was built by Indian workers on the orders of Dara's father.

(pic source: wikipedia)

Dara was the most learned and compassionate in a dynasty characterized by excesses that causes resentment to this day. He respected, even celebrated the pluralism of the dharmic thought system that has defined India since times immemorial. In unbelievably stark contrast stands his brother, the fanatical Aurangazeb, who unfortunately for India, prevailed in a tense struggle for the throne and had Dara killed most gruesomely on charges of blasphemy, before proceeding to slaughter about 4.6 Million Hindus (NY Times, 2011), statistically ranking him at #23 in the all-time list of mass killers (WW2 is at #1).

June 6: edited typos.

Tuesday, September 4, 2012

Visiting the Land of the Ramayana

India is timeless. Returning from there is always the difficult part and every trip to the land of the Ramayana and the Mahabharata invariably feels too short, and the most recent visit to South India was no exception.

India frustrates. Six decades of Soviet-style centralized planning after two centuries of looting by the British has wrecked the post-independence economy and sapped much of it's optimism. Economic liberalization introduced in the 1990s to rescue the economy has now slowed down. India is living proof that populist socialism works wonderfully in theory, but in practice brutally extinguishes the hopes and lives of millions. I have had first hand experience. India's first and foremost modern ORMS and analytics practitioner, P. C. Mahalanobis constructed large-scale linear programming models in the 1950s to optimize such grand centralized planning goals - an exercise in futility and certainly not the science and practice of 'better'!
(pic source: www.famousscientists.org)
Incidentally, one of the members of today's NAC (national advisory council), an unaccountable group of secretive leftist planners that work totally outside the purview of the Indian parliament, is Jean Dreze, a naturalized Indian citizen from Belgium who appears to have learned the art of coming up with equally grand centralized planning models (for the 21st century) from his father, who was both an operations researcher and economist. Not surprisingly, these grand schemes have failed miserably during human testing. It seems the modeling assumptions did not account for reality.

Mahalanobis did however leave behind a positive legacy. He founded the Indian Statistical Institute that produces many smart ORMS and statistics graduates to this day. He was a contemporary of the legendary Srinivasa Ramanujan and there is a well-recorded story of PCM posing a math problem to the young math genius from Tamil Nadu, who while cooking, answered the question and also provided a solution to the more general case.
 
Perhaps a major reason why India still has above-average GDP growth is the natural entrepreneurial spirit of its talented people that simply refuses to die. There is a market for everything in India.

India enchants. By the time I wake up in the morning in my ancestral village in the temple state of Tamil Nadu, my mother has created her Kolam (Rangoli) patterns in front of the house.
(pic source: /farm3.staticflickr.com)
In the old days, the designs were done using rice flour, so the little ants could feed on it. According to Indian belief, all living creatures, big or small, have souls just like humans. I doubt if my mother bothered to check if the Kolam path she traced every morning for the last 40 years was a Hamiltonian circuit or not ...
(pic source: 3.bp.blogspot.com)


India challenges. We board a train from Bangalore to Chennai. The seats are numbered sequentially but the ticket does not provide a deterministic clue on whether we have an aisle or middle seat. My family has contiguous seat numbers, but we soon discover that the seats themselves are not. A sole traveler shifting away from his window seat would have solved the problem in a jiffy but he refuses to oblige. We discover two other families facing the same problem. We perform an elegant three-way swap that would have made Lin and Kernighan proud, and enjoy a global optimal solution to this combinatorial problem for the remainder of the journey. It's about time the Indian Railways switches to alphanumeric seat labels.

India corrupts. I notice the beginnings of a flyover (overpass) in my village-town. Clearly there doesn't seem to be a need for it since the benefit/cost ratio seemed rather poor, but the politicians wanted one, so the town has to endure it. They're also widening the train tracks that go thru the town, which actually appears to be a sane idea. However, they want to rebuild a working bridge to accommodate this change. The crazy guys try to demolish the old bridge, but it proves to be too strong, so work is delayed. Eventually the new one will come up and will most likely be built with sub-standard building material.

India heals. I visit the temple of my Ishta Devta (approximately translates to: 'preferred iconic embodiment of the divine') that is located on a hill in Pazhani,Tamil Nadu. In the past, many fervently monotheist invaders of India mistook this sophisticated Indian concept for "idol worship", leading to genocide and wholesale temple destruction. sigh.

(pic source: upload.wikimedia.org)

I visit this famous temple the traditional way by climbing the many hundred steps to the summit. It's also a great morning work out. My family choose the popular modern mode of transportation and take the cable-car and arrive 30 minutes later! There appears to be a classical circulation problem hidden there.

(pic source: commondatastorage.googleapis.com)
The temple staff appear to be practicing some form of revenue management while also maximizing cable car capacity utilization. Uphill rides are twice as expensive as riding down, off-peak rides are half-price, and they wait until the cars are at capacity before launching. Hence the delay. Once inside the temple complex on the top, the administrators appear to employ 'lot sizing' where people line up and then ushered in to view the Murthi (icon) of the deity in batches that seem to be somewhat synchronized with cable car arrivals at the top. Thus I derive no significant advantage in getting to the top earlier than the cable-car riders. You either wait at the bottom of the hill or on top and the total time spent in the system is practically constant.

India beckons. All said and done, I cant wait to get back. Until then, here's an audio sample of South Indian classical (Carnatic) vocal synced to Western instrumental music.