Wednesday, May 23, 2012

Optimizing your Microwave Oven Performance using an Appalam

A far-out post on 'optimization' and 'parameter estimation'.

No two microwave ovens behave the same way even if they have the same power rating and capacity, and over time they show increased randomness in terms of energy usage and solution quality. Each one has its idiosyncrasies and as you move between apartments over the years, it is irritating to adjusted to a new oven. After you invest all the time in figuring out that the optimal settings to warm your cold coffee is 50 seconds in the previous home, using the same timing with the new one results in a lot of spilled coffee. Furthermore, objects get heated slightly quicker when placed in certain locations of the oven. What is a quick way to optimize your vessel placement and minimize your turn-around time? Enter, the Appalam.

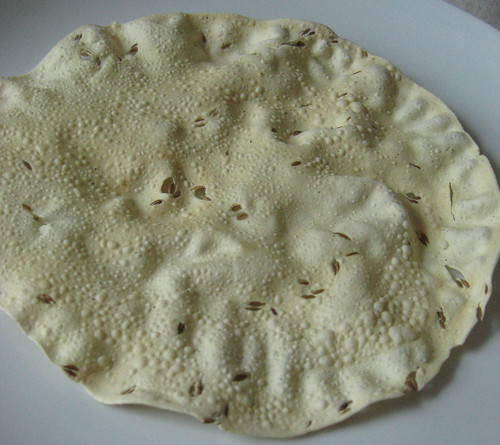
The Appalam or the Pappad as it is called in Northern India is a circular, flattened, wafer thin dry mixture of lentils and spices. It is an almost fat-free, delicious snack if you microwave it although it can also be fried. In particular, the best brand for this test is the Lijjat Pappad. This one is hand made (or used to be). The Lijjat company rose from a tiny all-women cooperative start up in rural India (based on Mahatma Gandhi's principles of self-reliance, theirs is a remarkable and inspiring success story) and is still going strong, producing outstanding Pappads in a variety of flavors.
 

The idea is pretty simple: The Lijjat Pappad (LP) has a relatively large surface area that covers 75-100% of the circular glass tray in most residential microwaves. Microwave the LP for about 60 seconds and note which of its parts get heated up first (visually seen via a change in color) and how the cooking progresses. Within 60 seconds, you should be able to figure out the hottest and the coldest spots in the oven. In my current residence, the middle of the oven turned out to be the coldest, which was the exact opposite of the result in my prior residence. Of course, this is not intended to be a universal setting and only applies to a subset of foods being heated up.

Why the LP works relatively well for such a test:

1. The consistency of the LP mix is quite remarkable. It is neither thick to resist microwaving, nor too thin and very rarely exhibits any significant warping even after 120 seconds of microwaving (it will simply get carbonized before it warps).

2. The material naturally does not conduct heat well and convection doesn't help much either, so the localized heating effects show up visibly.

3. You can make a meal of your experimental subject once your test is complete. No test goes waste!

Wednesday, May 2, 2012

Optimal Shoelacing

There are gazillion alternative ways to tie your shoelaces of which only a few patterns are easy to remember and possess nice symmetry.


My daughter got her first laced shoes a few weeks ago. As she took it out of the box, the first noticeable thing was that the slack required to tie the laces appeared to be on the shorter side. This posed difficulties for my daughter while she was learning to make those neat knots. Rewiring the shoes resulted in quite a bit of slack, which resulted in big knots that not only helped her learn quickly, but also seemed irresistible to her kindergarten classmates who kept tugging at it. So the aim was to find a lacing pattern that would generate just the right amount of slack.


This is of course an instance of a Traveling Salesman Problem (TSP). Each lace hole represents a city which can be visited exactly once. For example, the slack is maximized by finding the shortest tour, while the slack can be minimized by finding the longest Hamiltonian circuit. Of course, my daughter would prefer finding a good balance between these two extreme solutions, while also ensuring that tightening and loosening the laces are relatively easy to perform. The former objective can be equivalently specified in terms of minimizing deviation from a desired tour length, while the latter requirement can perhaps be approximated by eliminating unfavorable connection patterns and reducing overall friction.


Any OR person will tell you this: just because the TSP is a notorious NP-Hard problem, it does not automatically mean that practical instances are terribly difficult to manage. On the contrary, OR methods excel in quickly finding amazingly (and provably) good answers to practical instances of underlying TSP substructures within decision problems across a variety of industries.

Saturday, April 28, 2012

House Hunting Inefficiently

If you are looking to be more time-efficient in hunting houses, see a prior post here

Halfway through the house hunt, the process began to get mechanical. There was not much diversity in house designs, especially the newer ones, although there was this really nice and shiny new house adjacent to a cemetery, which threw me off a bit. Internet forum opinions ranged from "Loved it. Quietest neighbors I ever had" to "Hey, its Halloween every night here!".  The older ones seemed to have more character and personality. However, they came with their own maintenance list. I then got quite interested in the principles of the amazing ancient Indian science of construction and planning 'Vaastu Shastra' that actually turned out to be a pretty useful practical guide (better than my realtor sometimes). And so the search continued ..

A common reason for many houses in the U.S (perhaps not as common in India) being put up for sale is that the children grow up and move away, and their parents want to downsize. Such houses are inevitably full of memory trails frozen within photo frames: childhood sketches, family reunions, high-school trophies, often ending with snaps of a daughter's wedding. Looking at those pictures changed the objective function. What was 'just' a house to tick off the list, was for many years a home where a family was raised from the cradle, parents aged gracefully, and kids grew up with security. That is no easy thing to pull off in today's world, and perhaps there would be very few things more satisfying that emulating what some parents in those families did. It was quite humbling. Each such 'ordinary' house had an extraordinary American tale to tell, some happy, some not so. And no matter how much money one pours into home improvements, that unique signature of how a family lived in that home does not really go away; after all, a family breathes life into a house. 'Must-have' product attributes no longer seemed that important. House-hunting stopped, and the search for a home began. This approach may be inefficient, but it certainly feels more rewarding and less tedious.

Saturday, April 21, 2012

Housing Industry Analytics: Short-Sale versus Foreclosure

There's been an explosion of 'short sales' of housing properties by banks in the US market. In the east coast markets, there's been a 60-100% spike in short sales, why? If the banks wait too long and then foreclose, the properties loses too much value and the final returns may be lower. On the other hand, a short sale is immediate, and long term risk is eliminated. As the article in the NECN link above says:

"In a "short sale," banks agree to let someone who owes more on their mortgage than their home is worth to sell it to a new buyer, with the bank typically writing off tens of thousands of dollars in the process. But what the bank gains is avoiding the cost, protracted process and uncertainty around taking the home or condo by foreclosure and then trying to resell it as a bank-owned property."

A first look indicates that this is a decision optimization problem under uncertainty that is somewhat similar to (but not the same as) that faced by fashion retailers who are trying to clear their end-of-season perishable inventory. Do they markdown apparel right now or should they wait for some more time? If they wait, then over time, the 'fashion statement' value deteriorates and the retailer may have to more aggressively markdown to attract customers and clear inventory. On the other hand, if they markdown right now, that may turn out to be a hasty and expensive decision, with a certain probability. So really there are two decisions to be made: when to markdown and by how much?

A bank may own a majority stake in several properties whose values are depreciating over time in an over-capacitated market (property owners are unlikely to have the cash to maintain or make improvements), which they need to get off their books without losing much. Using stochastic optimization methods available in the field of Operations Research ("the science of better"), they may be able to do a much better job of profitably managing their inventory (it won't be surprising if they are already doing this). Stochastic optimization methods are specifically designed to work with probabilities of scenarios, as opposed to a deterministic approach that assumes everything is perfectly known in advance, although the latter often turns out to be a reasonable and quick first approximation. An alternative that may be especially appealing to pessimistic banks looking to avoid worst-case meltdowns is 'Robust Optimization' that can operate without formal probability distributions and can among other things, help minimize a bank's maximum regret. Another advantage of OR methods is that they are typically not capital intensive, and the ROI on successful projects can be remarkably high. In short, OR can be very, very useful here.

Tuesday, April 17, 2012

Analytics and Cricket - VIII: DRS & Bayes Theorem

In the last post on cricket, we mentioned that the false positive (F+) issue with the Decision Review System (DRS) employed in international cricket could be a deal-killer (see red zone in picture below).

In this post, we work out an illustrative numerical example using a well-known conditional probability model based on reasonable data derived from interviews of ICC personnel to show that the current F+ rate disproportionally reduces the efficacy of the DRS, causing it to operate only marginally more effectively that the human-only (umpire) method, and thus may not be worth the cost of maintenance unless the F+ rate is reduced to a more acceptable level.

For brevity, let's focus on bowler reviews in this example. A bowler will ask for a machine review of an umpire's original decision of not out, hoping to turn that into an 'out'. Umpires in the elite panel are themselves around 90% effective in making the right decision (so on average, only 10% of the subsequent DRS referrals should change the outcome if they work perfectly), so it is really that 10% gap that is the problem.

Today's cricket DRS system is claimed to be around 95% accurate in giving a batsman out, if in fact, the batsman is really out. Suppose the DRS also yields F+ results for just 1% of the bowler reviews, i.e. it gives a batsman 'out' when he is really 'not out' just like the umpire originally said. If 10% of the batsmen subject to bowler reviews are actually out (as obtained in the previous paragraph), what is the probability that a batsman is actually out given that the DRS overturns the umpire's decision to say he is out?

Answer: Let OUT be the event that the batsman reviewed is actually out (its complementary event is NOTOUT), and RED the event that DRS gave him out. The desired probability P(OUT|RED) is obtained using the Bayes formula by:

P(OUT|RED) = P(OUTRED)/P(RED)
Expanding out the terms, we can write this as
= [P(RED|OUT) x P(OUT)] /
[P(RED|OUT) x P(OUT) + P(RED|NOTOUT) x P(NOTOUT)]

= [0.95 * 0.1] / [0.95*0.1 + 0.01 * 0.9]
= 0.095/0.104 = 91%

Observations
1. Even a 1% F+ rate brings down the true efficacy of DRS, and it is not 95% as the ICC claims. The second term is a combination of F+ rate and human accuracy. Thus
P(OUT|UMPIRE SAYS OUT) = 90%
If the bowler asks for DRS review:
P(OUT|DRS SAYS OUT) = 91%
Not much of an improvement

2. The better the umpires get at their job, the worse the existing DRS will statistically perform. For example, if the umpires improve their upon their accuracy by just one percentage point, i.e. to 91%, the conditional accuracy of DRS changes to:
= [0.95 * 0.09] / [0.95*0.09 + 0.01 * 0.91]
= 90%


Thus, the tables are turned now and the DRS makes things worse for batsmen here and we may be better off not using DRS at all even if it is provided free of cost!

This second result may seem puzzling. Why does this happen? If the umpires get better, the frequency of true NOTOUT is 1% higher, and with the F+ rate held constant at 1%, there will be an increase in the total number of false positives over a period of time, in addition to a small decrease in count of true positives, thereby reducing the accuracy rate of the DRS.

You can plug in a variety of numbers to see what the corresponding results are. You can also perform a similar analysis for batsman reviews.

Recommendations:
1. Significantly cut down on the F+ rate and not just focus purely on increasing true positive rate

2. Improve the quality of original human decisions. This will reduce the dependence on DRS, encourage improvements in the DRS to keep pace, and obviously improve player attitude toward umpires.

3. If a brilliant cricketing instinct filled person like Mahendra Singh Dhoni talks about 'adulteration of human and machine', do think twice about it, he's got a useful math model behind this statement!

Reference: Introduction to Probability Models by Sheldon M. Ross. This example is a variation of an example from this book. Hope I did not mangle it.

Monday, April 16, 2012

Anatomy of an Online Debate

The Huffington Post ran a curious online debate a few days ago: Is Yoga a Hindu Practice? Let me state right of the bat that I thought the debate was utterly idiotic given that this question was like asking people to vote if baseball was quintessentially American, if the great pyramids were Egyptian, or if the great wall was built by the Chinese. After all, how the heck does a person debate against a fact? By twisting it into a silly insinuation about ownership. Nevertheless, let's look at the debate results measured by market-share for, against, and neutral to the topic, tracked before and after reading the debate. 


If this picture is unclear:
For, against, neutral (baseline) = (65%, 26%, 9%).
For, against, neutral (after reading debate) = (66%, 28%, 6%)
So the net result is that the 3% of the undecided split 1% toward 'for' and 2% toward 'against' after reading the debate.

Warning: If you are a predictive analytics connoisseur or swear by rigorous statistical methods, the rest of the post will be cringe inducing, so read on at your own risk.

Given that we have absolutely no data to use other than this pie chart, I tried to 'quick fit' a plausible Multinomial Logit choice model to these results with the aim of personally understanding how useful this debate really was. Toward this, I defined a utility function u(t) = exp (a0(t) + a1(t)), where:
a0 = baseline contribution for (t = aye, nay, neutral)
a1 = debate contribution
market share (t) = u(t) / (u1 + u2 + u3)

Using the 'before' pie chart, I obtained the following values:


where CONST = a0, and a1 = 0 at this point. Again, note that these are just plausible values and not statistically calibrated likelihood maximizing coefficients based on historical individual observations. Next, merrily using the  'after' pie chart to update the utility function taking the debate into account, I obtained the following values:


where DEBATE = a1 that is used to update the utility function. Note that the results don't really change dramatically.

Based on this plausible MNL model, we observe a positive value for a1 for both the 'for' and 'against' since their market-shares increase after the debate, and a negative value for 'neutral' since the debate forces a good chunk of the few fence sitters to switch. To measure the usefulness of the debate to each group, I looked at the ratio of "what was additionally useful" versus "prior understanding", i.e. the ratio utility_before/utility_after given in the last column. The results indicate that the debate itself was pretty close to useless to the overwhelming majority of the voters, i.e. for the 'aye' people (like me) and on the whole, the debate reinforced what they already knew, yielding a tiny usefulness change of about 0.4%. On the other hand, the debate was relatively more useful to the 'nay' people and it incrementally 'hardened their position' by about 6%. More than a third of the miniscule fence sitters actually took a stance and this debate appealed most to them.

Given that the voter response ('elasticity') for a particular choice-group to an event (debate) in an MNL model also depends on the incremental gain possible from their existing market-share, the degree of movement in market-shares for the three groups are not surprising, although the specific direction of the resultant net shift in market shares does indicate that the debate may have had something to do with it. Of course, one can game such online "changing minds" debates by entirely ignoring the debate and starting with a non-favorite position as the baseline and then simply selecting your most favorite position in the end.

On a side note, almost all the 'Yoga' practiced in the U.S and the west is really Yogasana, whose primary function is to help prep your mind and body for actual Yoga, which in turn has nothing to do with whether you can twist yourself into an exclusive USPO patent-protected double-pretzel or not, and everything to do with open-source inner-sciences that aim to rid a mind of ego, exclusivity, and dogma and reach higher levels of consciousness.

Monday, March 26, 2012

Gender-Shaping III: Is Amartya Sen's Missing Women Count Exaggerated?


This is the third post in this series on gender-shaping. The previous installment can be found here. Thanks to a twitter link, I came across a 2010 journal paper: "Missing Women: Age and Disease," Siwan Anderson (University of British Columbia) and Debraj Ray (New York University) published in Review of Economic Studies Vol.77.

This paper has among other things, investigated Amartya Sen's '100 Million Missing Women of India' claim that is attributed to systemic discrimination. Anderson and Ray have estimated the number of 'missing women' in India, China and Sub-Sahara Africa by age and cause-of-death (not done before) while also moving away from the simplistic aggregate sex ratios that were used as baselines in prior works. The authors make the following useful observations: Defining missing women by differences in aggregate sex ratios can be misleading, or uninformative (or both). It is misleading because different countries have different fertility and death rates, and (in particular) different age distributions. They will have different disease compositions.
They may also have different sex ratios at birth for genetic or environmental reasons that have nothing to do with missing females
.

The procedure is also uninformative: we cannot tell at what ages the missing women are clustered, or what diseases are responsible. Thus, we cannot begin to ask about the various
channels: discrimination, biology, social norms, and so on. Answering these questions is of profound importance. By unpacking missing women by age and disease, our paper takes a limited and preliminary step in this direction.
"

From an OR perspective, we extensively rely on similar customer segmentation models (in revenue management for e.g), and this additional age- and causal-factor based segmentation appears to be quite important and yields two main results as well as a comparative result that may be interesting to an U.S audience:

1. A large fraction of the missing women in India are not infants (less than 20%) but adults, and is attributable to other factors like disease and injury, apart from any systemic discrimination. Consequently, any claim of exclusively female infanticide driven 'missing women' in India is rejected. On the other hand, this paper finds that 44% of China's missing women are in the prenatal age-group. Here is a snapshot of sex-ratio by age, taken from the Anderson & Ray paper:


2.The authors make an interesting comparative comparison with the U.S: "we observe some similarities between age-specific percentages of missing women in the historical United States (ca. 1900) and India or sub-Saharan Africa today".

3. The Sen count (100 million missing women) appears to have been calculated with respect to a specific counterfactual: The overall sex ratio for N. America, U.S and Japan. An alternative calculation by Coale (1991) comes up with a more conservative estimate of 60 million. Anderson and Ray perform similar calculations but at the segment level (i.e. by age-disease) and generate missing number estimates using more carefully chosen counterfactuals as the baseline and find approximately 20 million missing women in India (aggregated across all age groups), while the corresponding figure for China is 58 million. Furthermore, 'injury' is not an insignificant culprit in India across all age groups, a potentially worrying trend that its government must look into. (The paper alludes to the old bogey of 'dowry deaths' as a probable cause which may not turn out to be the case. A similar detailed analysis is required).

The findings of this paper also weakens a statement in a previous post on this topic that a skewed overall male:female ratio in a region is a 'scary indicator' of female infanticide being practiced there. My statement ignored the age distribution as well as the 'cause of death' dimension. Bad O.R, but I have Amartya Sen for company.

Thursday, March 22, 2012

The Optimal Playlist

One of the problems with neighborhoods in parts of Connecticut is the lack of sidewalks coupled with crazy drivers (probably from a neighboring state to its left). To avoid getting run-over, I decided it is safer to do my walking on the treadmill. I'm now getting all the exercise a creaky researcher needs, but I'm not getting anywhere. To overcome this monotony, I hooked up my old iPod-classic for company, but it's time-consuming to generate my preferred playlist : start off with some up-temp music for motivation, then switch to cruise mode, and tone down after my 30/60 minutes of walking.

In India, we have the concept of 'Rasa', a Sanskrit untranslatable that very roughly speaking, includes notions of experiencing certain emotion(s), themes, ambiance, genre, etc. So the sequence of Rasas  matters a great deal. Furthermore, I like to listen to complete songs and hate to end a virtuoso Carnatic performance half way when the exercise session-clock runs out. Furthermore, there are so many languages in India and many have their own pop-culture, folk, and classical genres in instrumental as well as vocal modes, and I prefer a diverse sampling of these to feel more at home.

Putting all this together to achieve an optimized playlist requires a constraint-programming approach. If I also want to optimize a certain objective (e.g., stay close to 12 songs), this turns into an exercise of solving an associated discrete decision optimization problem that can be stated as follows:

Find (preferably) 12 complete non-repetitive songs in a preferred sequence that lasts (almost) exactly 60 minutes, and includes at least n(i) songs having user-specified attribute (i), i = 1, .., n.

If we restate the attribute requirement as a soft-constraint by creating a score-table for including any attribute (e.g. 10 points for including a song with attribute i once,  15 points for two songs with attribute (i), 17 if three or more times) as opposed to the 'must satisfy' version stated earlier, then the playlist optimization problem can be posed as a attribute score-maximizing multiple-choice knapsack problem with a cardinality constraint, followed by a sequencing step. Even with a huge home music database, practical instances of the latter formulation may be relatively easy to solve via combinatorial methods (iPhone app?) and may not require expensive MIP solvers. Then, as a second step, we can sort the included songs into another preference-score maximizing sequence to generate the final playlist, unless of course the sequencing requirements are not that simple (in which case, a more sophisticated optimization approach may be required).


Such an optimized playlist is also useful if you want to build an auto-pilot DJ for your next house party. If your approach can solve this problem on-demand, you would also be able to dynamically re-optimize the playlist after manual intervention.

It seems apt to terminate this post with a Carnatic-Western classical fusion piece.


Updated on March 30: The objective function above is deterministic so there is a good chance that the you will get the same set of songs to listen to each day, which is not very useful. To introduce diversity and exploit the fact that in practice you tend to get several alternative optimal solutions to such problems, add a small amount of clock-dependent noise to the attribute-score and sequence-preference score. This will likely do the trick.

Thursday, March 1, 2012

House Hunting Efficiently

One of the consequences of the kind of convergence shown in this graph was that it created the need to buy a house. It's become a ritual to spend weekdays creating a list of houses that are feasible with respect to hard constraints (big kitchen, level lot, ..), and then converting that into a prioritized list based on how they score on soft constraints (pre-wired for Bose speakers, for example) that in turn motivates a preferred way of visiting these houses during weekends. I noticed that I rarely see each house in isolation and my view of a house tends to be colored by what I saw earlier. However, of late, the time to view these houses has become a scarce resource, so I created an O.R driven prioritized list that maximizes and optimally allocates viewing time, keeping the total duration equal to the limited time available. I used my automobile GPS unit as the solver.

This GPS unit "solves" the Traveling Salesman Problem (TSP) to figure out the optimal (?) order of visitation that minimizes total drive time, which automatically maximizes aggregate viewing time. (In particular, if houses are located on either side of a busy highway or Main Street, a good heuristic would be ensure that the optimal path intersects such a link infrequently.) I can then allocate the optimal expected viewing time to the houses based on personal preferences. The total viewing time also informs me if I have spread myself too thin, in which case, I can start deleting houses with the lowest scores from the list and re-optimize until the solution looks reasonable. 

If viewing order is important from a 'relative comparison' perspective, the resultant constrained TSP problem becomes a bit more harder to solve using a GPS unit. A simple heuristic rule could be to fix the second node ("first house to first") and/or the second-last node ("house to visit last") of the tour and let the others be visited based on time-optimality. If your realtor drives you around, her/his office is the start and end node of the Hamiltonian circuit.

One issue I encountered while using the GPS unit to merely drive-by a house as part of a local neighborhood search (pun unintended) is that I had to get close enough to the house and maybe pause a bit to inform the GPS that this house has been reached. Otherwise, the GPS unit would continually re-route me back to the house, resulting in considerable confusion.

Saturday, February 25, 2012

Analytics and Cricket - VII : Does DRS have a False Positive issue?

The last post related to cricket was quite a while ago (that the Indian cricket team has been repeatedly thrashed since then is a mere coincidence). This post focuses again on the Decision Review System (DRS), a technology-aided analytical decision-support system to aid cricket umpires. The toolkit includes a set of multiple video cameras,  heat-sensing 'hot spot' technology, and ball-tracking devices that record the point of impact, as well as an additional set of predictive algorithms to forecast the counterfactual trajectory of the cricket ball (you can be forecasted 'out' in cricket). Despite the best efforts of cricket's custodians, considerable user unease with the DRS persists. In fact, it has been recently acknowledged that the use of the decision support system has had a significant impact on the game (user response: altering playing styles and inducing more 'OUT' decisions from umpires), something which this tab predicted a year ago.  Reasons for discomfort also include the lack of uniformity in its deployment, the incremental dollar cost of the DRS versus incremental returns, and equally importantly from a fan and player perspective, DRS reliability (both real and perceived). This post will focus on the last two issues.

The International Cricket Conference (ICC) has focused almost exclusively on improving the technology (e.g. increased number of video frames per second, etc). The main argument here is that while an improvement in the unconditional success rate for the DRS may seem impressive, it would be more helpful if statistics are calculated and presented conditional on the corresponding human decisions made. Toward this, let's look this MBA-ish 2x2 decision matrix (sorry). Strictly speaking, the terms 'correct' and 'incorrect' in the matrix mean 'almost surely correct' and 'almost surely incorrect', respectively .


1. The ICC has a wonderful set of umpires in their 'elite panel' that referee the most important inter-nation test matches (these elite umpires are a scarce resource, and their globe-trotting schedule optimization is yet another operations research problem - perhaps a good topic for part-8 of this series). Prior to the DRS, the umpires achieved a respectable success rate of more than 90%. Consequently in such situations, the DRS getting it right is a relatively uninteresting event. This situation is denoted as the neutral zone (top-left box). Therefore the focus is on the remaining 7-10% of the time when the decisions are contentious.

2. Clearly the case where the umpire is wrong and the DRS is right (as judged by video and predicted-trajectory evidence) is a win-win for the DRS and players. This is the green-zone (bottom left) and appears to be the exclusive area of ICC's focus as far as technological improvements. However, it is not necessarily desirable to accord top priority to the goal of achieving further improvements in this statistic.

3. The problems arise when the DRS occasionally produces visibly and audibly confounding results. This is represented by the top-right box, the 'high conflict zone'. In some instances, it could be because of technological gaps or operator error (there was a recent example where an umpire whose sole job consisted of watching the TV replay and hitting one of two buttons managed to hit the wrong one). However, in other instances, the predictive component of the DRS that is used to probabilistically judge LBW (leg-before-wicket) 'OUT' decisions appeared to be flawed or incompatible because:

a. Greater the required length (or duration) of the predicted values, the more noisier the forecasted trajectory.
b. Lesser the observed portion of the ball trajectory available for 'training' (especially after spinning and bouncing off the cricket pitch), the less reliable the prediction.

The years of prior refereeing experience of the umpire, and other human cognitive powers that help him arrive at the decision is pitted against hardware and algorithmic prediction prowess. The challenge is to be able to be aware of the many degrees of freedom involving a rotating cricket ball in motion while also taking into account the effect of the cricket pitch and local conditions.

4. There may be rare irritable cases where despite best efforts, uncertainty prevails and both the umpire and DRS manage to get it wrong (bottom right box).

If the ICC can provide data on the frequency of observations that fall in each of these 4 boxes, we can of course calculate the conditional probability of a correct decision given the DRS response using well-known conditional probability models and compare with the corresponding results for the manual system. For example, how likely is it that the batsman is actually OUT given that the DRS overruled an umpire's original 'NOT OUT' decision? Such analyses helps figure out the impact of false positives and false negatives that comprise the conflict zone observations. In particular, the false-positive rate, i.e. the case where a batsman tests positive ('OUT') using a DRS when he is actually NOT OUT, should be minimized given the nature of this sport.

Recommendations
The biggest stumbling block appears to the the top-right box (high-conflict zone) that erodes user trust every time the DRS wrongly overrules what appears to be a sound cricketing decision by the umpire. As a priority, the ICC should isolate and eliminate those components that increases the occurrence of such situations. The likely candidates for culling will be the trajectory-predictor and existing flawed versions of 'hot spot'. These innovations should be reintroduced at a later stage only after sufficient improvements have been made (and while also keeping the resultant cost down) to ensure that the expected failure rates are well under control. Viewed from this perspective, a recent decision by the Indian cricket board to do away with the predictive component of the ball-tracking technology is actually the right one.

@dualnoise on twitter

Sunday, February 12, 2012

Gender Shaping - II

This tab examined the issue of 'gender shaping' last year and we continue the discussion here. This time we analyze simple probability models related to this issue. Imagine a population in a geographical area where parents adopt a policy of 'stop having children after the first boy'. Surprisingly (or maybe not), this practice in itself cannot really 'shape' or affect the stability of the population, as neatly explained by Prof. Thomas C. Schelling in his book 'Micromotives and Macrobehavior':  no “stopping rules,” like stopping after the first boy, can affect the ultimate proportions. At the first round, half the babies will be boys. At the second round, only half the families have children, but they will be half boys. The half with only girls will proceed to the third round and again, by the 50–50 hypothesis, half will have boys and half girls. If at each round half are boys and half girls the total—no matter where it stops—will be half boys and half girls. (A corollary is that we know, without adding, how many children will be born. In the end, every family will have one boy; girls will equal boys; and, the average will be two children per family.)

Dr. Schelling also mentions: "It has occasionally been proposed that this motivation might explain a slight excess of boys over girls in some populations. Where female infanticide is practiced it is bound to have that result."


Thus when one sees F-M ratios like 89:100 in some pockets of Northern India, it's a scary indicator that a sizable percentage of baby girls have been murdered (the Gov of India has had in place a strict ban on sex-determination tests for many years now). Female infanticide is a relatively recent phenomenon in certain sections of society within India's 7000+ year culture where women were typically accorded an equal (perhaps higher) status compared to men. Russel Ackoff has discussed a related issue in his classic book many decades ago.

Although the boy-driven stopping rule does not affect the stability of the population and the resultant average family looks pretty normal, the internal distribution is asymmetric (another example of the flaw of averages?). For example, a boy will either be the only kid or the youngest kid in the family. In the latter case, the parents are 'focused' on producing a boy and then tending to his needs and thus more likely to ignore the needs of their girl babies, and as the family gets bigger, this situation, on a per-capita basis is likely to get worse. These conclusions are largely confirmed in a recent NBER econometric/statistical study that uses data-driven analytical models to answer the question "Are boys and girls treated differently". Girls brought up to adulthood in such a biased environment may well help perpetuate this vicious cycle in certain parts of India. The U.S. does not appear to suffer from the problem of gender-shaping, although the pro-abortion groups have required some deft arguments to enunciate their stance on the selective gender-based abortion question posed by anti-abortionists. On the other hand, there may be some issues to be overcome with respect to investments in girl children as far as their career choices, as very briefly touched upon in a prior post.

Tuesday, January 24, 2012

The King and the Vampire

Read this Wikipedia entry if possible to enjoy the format of this 'fun' post a bit more.

(pic source link: Wikipedia)

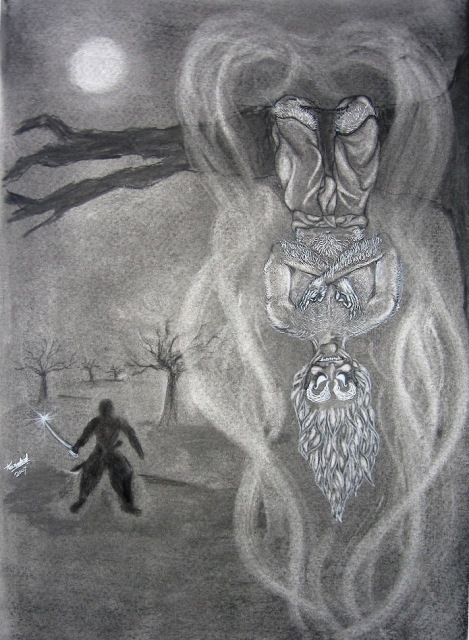
Every Indian child has grown up listening to the stories of King Vikram and the Vetaal (some kind of vampire spirit who  often clambers up a drumstick tree). It used to be particularly exciting to read these tales in the children's magazine Chandamama, where the first paragraph went something like this:

Dark was the night and weird the atmosphere. It rained from time to time. Eerie laughter of ghosts rose above the moaning of jackals. Flashes of lightning revealed fearful faces. But King Vikram did not swerve. He climbed the ancient tree once again and brought the corpse down. With the corpse lying astride on his shoulder, he began crossing the desolate cremation ground. "O King, it seems that you are firm about the decision you've taken. But it is better for you to know that there are situations where an O.R decision optimization project invariably results in complaints, which apparently requires another O.R project to fix! Let me cite an instance. Pay your attention to my narration. That might bring you some relief as you trudge along," said the vampire possessing the corpse. 

The OR vampire went on:
Years ago in a bankruptcy protected U.S airline in a windy city, a well-paid MBA consultant for the Onboard Services department (OS) approached our OR team to pitch a new R&D project to manage an inventory problem on a network. Apparently, OS was hit by a surge of complaints in recent times that contractually purchased hotel room inventory in several U.S cities served by the airline were left puzzlingly and 'dangerously underutilized' in the last few months, way off their usual levels. Could we help match supply and demand using our OR bag of tricks by moving things around in some optimal manner?

No, ..These complaints were not coming from Flight-Attendants (FAs), but from management folks in OS. If anything, the FAs were happier and chatty about the quality time they were spending with family and kids. FA's don't make the kind of money that pilots do but since there's roughly about 2-3 FAs for every pilot, he wondered if our team's OR-based crew scheduling system was giving away expensive 'happy hours' at company expense? .. yes, this problem started 3 months ago, How did we know? ....

It wasn't a guess. We deployed a shiny new optimization system for planning monthly crew schedules for OS just 4 months ago. Things were not looking good. Where did we screw up? We investigated the reasons for this and within a couple of days found the answer that had the entire team laughing and celebrating. We gave the consultant a brief answer that he was satisfied with. The 'network imbalance' project was shelved.

So tell me King Vikram, what do u think happened and why did my team laugh and celebrate? Answer me if you can. Should you keep mum though you may know the answers, your head would roll off your shoulders!"

Forthwith King Vikram replied: "Vetaal, this is one of your easier ones. The answer is in three parts.

1. A significant portion of the senior FA population were married women who were happy because they got to spend more weeknights at home. Their work-hours per week is upper-bounded by federal regulations and remains fairly constant if optimized well enough, which must mean that these FAs were spending a lesser proportion of time away from home than ever before while still making the same kind of money.

2. Since FAs don't get paid as much as pilots, a relatively expensive portion of their schedules is likely to be the hotel room and transportation costs associated with their overnight layovers. I suspect that the new algorithms in the scheduling system managed to uncover improved schedule patterns among those trillion trillion possibilities by identifying near-optimal daytime airport connections that yield a denser work-day in tandem with a shorter TSP sub-tour traveling pattern that brings them back home more frequently. Doing so must have also maintained or slightly improved the weekly productivity levels (otherwise management would not have bought into this model in the first place).

3. This result is a win-win for all stakeholders once the longer-term agreements with hotel chains are favorably renegotiated to sync with this newly realized reality. This is precisely what you must have told the consultant. Since all this was accomplished without additional capital investment using OR, 'The Science of Better', your team probably felt that their algorithm's practical effectiveness was validated by this 'complaint'.

No sooner had King Vikram concluded his answer than the vampire, along with the corpse, gave him the slip.


(pic source link: Chandamama.com)

Monday, January 16, 2012

Book review: Choke

This post reviews Sian Beilock's recent book:  
"Choke: What the Secrets of the Brain Reveal About Getting It Right When You Have To"  from an O.R. perspective, as well as from the p.o.v of Dharmic philosophy that has some deep connections to some of the mind-training techniques mentioned in the book.

Scholastic/Intellectual test situations
In addition to aspiring sport stars and business leaders who certainly want to avoid 'choking' at any cost, this book can be particularly useful to students who plan to take competitive scholastic tests. Beilock characterizes 'choking' as suboptimal performance, which implies the existence of a clearly superior level that becomes feasible via practical mind-training techniques. When it comes to tests like SAT and GRE, 'worry' can negatively affect the parts of the brain that are most involved ("working memory" in the prefrontal cortex) in the Q&A process and this can directly result in choking due to a suboptimal allocation of brain power. In fact when constrained by 'worry', lab experiments show that smarter students who routinely ace practice tests are likely to drop to a more seriously suboptimal level relative to 'average' students who face a similar worry. In particular, the book presents evidence that shows that the effect of negative gender stereotyping (e.g. "girls can't do math") has been devastating in the US, inducing a lot of female exam takers to 'choke' in such situations. Subsequently, many of these candidates reconsider their original choice of a STEM career. The author presents a systematic rebuttal of Larry Summers' controversial gender-related remarks in Harvard a few years ago that looks compelling.

An important technique that is proven to minimize the chances of choking during intense time-constrained testing situations is the ancient Indian method of Yoga and meditation that is freely available to anybody (Vipasana in particular, is recommended by the author. Even three months of adopting such methods are known to have beneficial effects). Now if one were to, over an extended period of time, move along this positive Yogic meditation gradient to maximize its benefits, one can practically experience higher states of consciousness and self-realization. This is a central truth-claim of the Dharmic thought system (DTS) of India. The 2011 book 'Being Different' by Rajiv Malhotra is a scholarly and well-researched book that expounds on DTS and is particularly useful for western minds that seek to understand what Yoga and Sanskrit (the language of Yoga) truly mean.


Sports  
Finely honed motor-skills and fluid movements are critical to achieving optimal performance. Here, one can think of the task of winning a contest as constantly solving two nested decision optimization problems. The meta-problem is to manage tactics and overall strategy, while the inner problem is how best to 'operationalize' the chosen objectives in real-time. A conclusion in this book is that one must certainly think about the meta ("what") problem using working memory. On the other hand, it is better not to (like Yogi Berra said) intellectually analyze the "how" part where a player makes real-time play decisions and executes a sequence of precise movements since these have been optimized (objectified?) over years of careful practice and then 'outsourced' to the brain's 'procedural memory'. It's like trying to analyze your legs as you descend a staircase in a hurry.

When it comes to crunch free-throws in basketball, it appears that an important 'choke' statistic is the conditional probability that a player will make the shot given that his/her team is one point behind. Apparently, this conditional probability differs by about 7% on average from its unconditional counterpart. As far as crunch-time soccer penalty kicks, well-established European league stars are more likely to choke and have a success rate of 65%, which is much less than future stars, whose conversion rate was above 90%. In baseball, home teams that are a game away from winning a series, win that game only about 38% of the time. Clearly, heightened expectations from supporters increases the chances of choking.


A useful point to remember that will help minimize the chances of suboptimal performance in any situation is present in a Sanksrit Mantra that was uttered after what can be viewed as the world's first ever choke, when Arjuna, the hero of the Mahabharatha, on the eve of battle, is consumed by self-doubt and initially decides against fighting the good fight and plans on simply walking away, before Krishna who was selected by Arjuna to be his charioteer in this battle, reminds him of his Dharma (a Sanskrit untranslatable, roughly means 'fundamental duty') and says, among other things:  


Karmanyeva adhikaraste ma phaleshu kadachana
Ma karmaphalahetur bhurma te sangostvakarmani.


"Your attention must be directed toward the action alone, never with its fruits. Let not the fruits of action be your motive, neither should you be inclined toward inaction".

As we can see, even heroes can choke, but the truly great ones have a reliable 'corner man' like support system that helps them find a way to turn it around.


[update: fixed format]