Pure Java based optimization tools released under benign licenses are popular in decision-analytics embedded industrial applications. They reduce maintenance efforts and deployment costs, keeping IT managers, analytical support engineers, and developers happy. No platform-specific issues to deal with. No license and patent infringement headaches.... It's a win-win for everybody, provided these 'free' analytical tools withstand the rigors of a production environment.
Recap: This tab summarized a set of pure Java tools a while ago here, talked about a DIY Java solver here that gets you to within a factor of 10-20 of CPLEX on combinatorial LPs, and chatted about "GooPLEX v1.0" some years ago here.
The new WVLPSolver library is introduced here (courtesy: Bharath Krishnan, data scientist at CQuotient). This new solver is worth a look because its v1.0 appears to be more well thought out compared to the initial version of 'Gooplex'. In particular, WVLPSolver seems to employ a revised simplex scheme that would allow it to work with a minimal simplex tableau (see an old but remarkable (if extreme) illustration of this advantage). Per the introductory post, it employs the reliable Colt library, and is released under the Apache license. These three factors alone may allow this tool to become a useful workhorse in specific situations ("think small"). Great work by the developers, and hope they continue to improve upon this initial release.
Big Data produces a variety of decision problems (recent post related to this topic). In some situations, and depending on the problem structure, you may end up needing to solve tons of small but independent optimization problems, and in other cases, relatively fewer giant monoliths where a considerable amount of sophistication is required to produce consistently good answers. In the former case, an IT manager has to decide whether he needs to budget for a million-instance licensed version of an industrial-strength solver that works cross-platform, or hack-a-heuristic that generates "user-optimal solutions" but may end up confusing users, or go with a nice, pure Java LP brew. Each option has its advantages and disadvantages depending on the context. For analytics start-ups that offer solutions having a relatively small OR footprint, the last option may sound appealing.
Monday, November 26, 2012

Monday, November 12, 2012
Operation Red Lotus and Jules Verne
Around the World in 80 Days
One of the few positive side effects of Hurricane Sandy knocking out power for nearly a week was the rediscovery of a childhood joy of reading history books and stories of valiant Indian queens and kings by the candlelight. Globe-trotting dreams of kids in 1970s socialist India who couldn't afford to set foot on an airplane were kindled by reading and re-reading stories like Jules Verne's fascinating adventure travelogue 'Around the World in 80 Days', a book written a hundred years earlier in 1873.
Indian Rebel
Just a few years before Jules Verne wrote some of his most popular books, the English government was engaged in a bloody, all-out war for economic power in the Indian subcontinent. The rebellion against the colonizers in 19th century India was not just a local mutiny of Sepoys (hired soldiers), and not just an uprising of the peasants; native rulers (Rajas), dashing queens (Ranis), naturalized Indian kings of the dying Mughal dynasty, military leaders, intellectuals, priests, bankers, traders, farmers, ... entire populations participated in the struggle to free India socially, economically, and culturally in what came to be recorded as the first war of Indian Independence fought in 1857. This is one of the many excellent findings recorded in the historical book "Operation Red Lotus" written by Parag Tope, a descendent of Tatya Tope, chief coordinator of the Indian war machine during that time period.
Jules Verne's Captain Nemo of 1870 appears to be a character straight out of this war. A hi-tech sea-faring native prince seeking vengeance against the English, Nemo is not far from reality. Native rulers set up navies that relied on the construction of relatively sophisticated ships to safeguard overseas trade interests that were being overrun by the piracy of the English East India Company (EEIC). This is hardly surprising given that the world's first dockyard was built in India and the maritime prowess of native kings on both sides of the Indian coast is legendary. However, the key battles of the 1857 war were fought inland in Northern India.
Operation Red Lotus

A wealth of information from recently recovered original correspondence to Tatya Tope during this time period appears to have encouraged the writing of this book. This excellent review summarizes the findings. While there is ample evidence to suggest that the strategy and tactics employed by the Indian resistance in 1857 was indicative of a comprehensive and long-term approach, claims of an sustainable war effort cannot be taken seriously (to paraphrase Gen. Omar Bradley) unless it can be shown that there was a feasible logistics solution in place. Operation Red Lotus (ORL) answers this question in the affirmative.

pic source
The Lotus Code: Operations Research and Logistics?
ORL is mainly about how Tatya Tope and other leaders on the Indian side designed a simple and neat supply chain to support the war effort and maintain an army of newly unemployed native soldiers, bereft of any provisioning infrastructure. Tatya's first step, like we do in the corporate world today, was to forecast enterprise-level demand - but he had to do this without tipping off the Red Shirts. Toward this, he exploited the contempt the colonizers had for 'backward' Indian rituals and traditions. Tatya Tope secretively sampled demands at the platoon level using a red-lotus based numerical code. The English were puzzled to see a spate of red lotuses being passed around the garrisons in many cities they controlled and initially attributed it to yet another weird 'blood red' native custom. The number of petals in a red lotus is approximately the same as the number of soldiers in an EEIC platoon.
 (source colorbox.com)
A native soldier who volunteered would pluck a petal and pass the flower on. After all soldiers made their choice, what was left of the flower was sent back to Tatya. By counting the reeds and/or the remaining petals in a returned lotus from a particular geographical location, noting the number of lotus-sampled platoons, and rolling up these estimates to a regimental level, Tatya was able to predict the approximate size of the native army by location. Having this fundamental information at hand, the planners calculated the provisioning required to sustain the war effort in its various stages, and also finalize the line of attack to capture and hold Delhi, the capital, as well as other strategically important cities. The next challenge was to geographically allocate supplies to satisfy this location-specific demand forecast given that the emerging native army did not have the resources or the time to rapidly create and manage their own own supply line. The only viable solution was to outsource this task, which was accomplished via the Chapati (an unleavened Indian bread) code.
The Chapati Code
After the flood of lotuses, the English were bemused to see Chapatis being exchanged by the chiefs of some villages. Alarm bells went off and they managed to intercept Chapatis embedded with lotus seeds.
 (source food fun freak blog)
The English concluded that this was not another strange custom and that the exchange of lotuses and Chapatis was some kind of a secret handshake. Red lotuses weren't found in the hands of villagers, and seeded Chapatis were not found in garrisons. What historians did not fully realize was that the lotus and the Chapati distribution were the code; not merely Boolean flags, but a vector representation of numerical information relating to troop strength and battle plans. We now know that the Indian war planners sent Chapatis to the various villages along a directional chain graph on a Euclidean plane whose source was a major garrison, and the sink was an important military objective.
 [ORL book extract]
The men of the villages that were ready to support the war effort would requisition and stock food grains, and the women of the village would be required to prepare food in quantities proportional to the number of Chapatis they received. The village chief would pass on a similar number of Chapatis to the next village in the designated chain. There is little doubt now that this was a coordinated and planned war to achieve self-rule.
Breaking Down The Supply Chain
When the time was ripe, the sepoys mutinied on the pretext of greased cartridges (immortalized by the legend of Mangal Pandey), catching the EEIC and the Victorian government in England off guard, and the initial phase of the war went against the colonizers. However, once they recognized the logistical method employed by the natives, the reprisals were eerily Nazi-like: swift, decisive and genocidal, and in keeping with a pattern that was repeated a few times before India's political independence in 1947. Villages on these chain graphs that supported the war effort were interdicted. Emergency laws were enacted that essentially gave English officers the license to kill civilians based on suspicion. Large populations, including women and children were wiped out, successfully disrupting the Indian supply chain.
 (source: wikipedia)
 (source columbia.edu)
Once the logistical backbone was broken, it was a matter of time before the colonials won the war. However, it turns out that the war also had some cascading international effects.
Global impact of the 1857 Indian War of Independence
The London government withdrew huge sums of money from their banks and investments, including prominent financial institutions in the U.S, to raise sufficient capital to fund and ship out tens of thousands of fresh troops to India to win the war, while publicly spinning this fiasco as a localized case of mutiny. This behavior did not escape the attention of some Americans who questioned the official version.
.
 [ORL book extract, pages 86-87]
ORL notes another pertinent question that George Train asked: "England says they are short of funds. Where are the hundreds of millions of silver that have been shipped there [India], disturbing the currency of the world?
The withdrawal of such huge sums of money by the English from US banks exacerbated the panic of 1857, and the resultant liquidity problem severely impacted the Northern states in the US besides triggering the world's first ever global economic crisis. Furthermore, the war hit the EEIC-pirated textile goods exported from India to the west, which reacted by sourcing more cotton from the southern US states that was being produced at even cheaper rates using African slave labor, thereby boosting the Confederate economy and morale. Thus, the Anglo-Indian war of 1857 appears to also have had some impact on the subsequent American civil war of 1861-65.
Jules Verne's Phineas Fogg is most likely based on George Train, a remarkable real-life American adventurer-entrepreneur who went around the world a few times, including a round trip in 67 days.
Legacy
It is less known that the Indian resistance achieved a few tangible victories for India in the long term. For brevity, we will have to leave that discussion for another day. India lost the 1857 war but those who resisted genocide became legend; none more so than the heroic young queen, Rani Lakshmi Bai. This coming Monday, November 19 is her birthday. Reading the immortal line in the Hindi poem about her in the candlelight as a kid, and then again a few days ago about her incredible exploits in ORL even as hurricane winds howled outside, never fails to bring a lump to the throat.
"She who gallantly fought a man's battle, was our Queen of Jhansi".
One of the few positive side effects of Hurricane Sandy knocking out power for nearly a week was the rediscovery of a childhood joy of reading history books and stories of valiant Indian queens and kings by the candlelight. Globe-trotting dreams of kids in 1970s socialist India who couldn't afford to set foot on an airplane were kindled by reading and re-reading stories like Jules Verne's fascinating adventure travelogue 'Around the World in 80 Days', a book written a hundred years earlier in 1873.
Indian Rebel
Just a few years before Jules Verne wrote some of his most popular books, the English government was engaged in a bloody, all-out war for economic power in the Indian subcontinent. The rebellion against the colonizers in 19th century India was not just a local mutiny of Sepoys (hired soldiers), and not just an uprising of the peasants; native rulers (Rajas), dashing queens (Ranis), naturalized Indian kings of the dying Mughal dynasty, military leaders, intellectuals, priests, bankers, traders, farmers, ... entire populations participated in the struggle to free India socially, economically, and culturally in what came to be recorded as the first war of Indian Independence fought in 1857. This is one of the many excellent findings recorded in the historical book "Operation Red Lotus" written by Parag Tope, a descendent of Tatya Tope, chief coordinator of the Indian war machine during that time period.
Jules Verne's Captain Nemo of 1870 appears to be a character straight out of this war. A hi-tech sea-faring native prince seeking vengeance against the English, Nemo is not far from reality. Native rulers set up navies that relied on the construction of relatively sophisticated ships to safeguard overseas trade interests that were being overrun by the piracy of the English East India Company (EEIC). This is hardly surprising given that the world's first dockyard was built in India and the maritime prowess of native kings on both sides of the Indian coast is legendary. However, the key battles of the 1857 war were fought inland in Northern India.
Operation Red Lotus
A wealth of information from recently recovered original correspondence to Tatya Tope during this time period appears to have encouraged the writing of this book. This excellent review summarizes the findings. While there is ample evidence to suggest that the strategy and tactics employed by the Indian resistance in 1857 was indicative of a comprehensive and long-term approach, claims of an sustainable war effort cannot be taken seriously (to paraphrase Gen. Omar Bradley) unless it can be shown that there was a feasible logistics solution in place. Operation Red Lotus (ORL) answers this question in the affirmative.
pic source
The Lotus Code: Operations Research and Logistics?
ORL is mainly about how Tatya Tope and other leaders on the Indian side designed a simple and neat supply chain to support the war effort and maintain an army of newly unemployed native soldiers, bereft of any provisioning infrastructure. Tatya's first step, like we do in the corporate world today, was to forecast enterprise-level demand - but he had to do this without tipping off the Red Shirts. Toward this, he exploited the contempt the colonizers had for 'backward' Indian rituals and traditions. Tatya Tope secretively sampled demands at the platoon level using a red-lotus based numerical code. The English were puzzled to see a spate of red lotuses being passed around the garrisons in many cities they controlled and initially attributed it to yet another weird 'blood red' native custom. The number of petals in a red lotus is approximately the same as the number of soldiers in an EEIC platoon.

A native soldier who volunteered would pluck a petal and pass the flower on. After all soldiers made their choice, what was left of the flower was sent back to Tatya. By counting the reeds and/or the remaining petals in a returned lotus from a particular geographical location, noting the number of lotus-sampled platoons, and rolling up these estimates to a regimental level, Tatya was able to predict the approximate size of the native army by location. Having this fundamental information at hand, the planners calculated the provisioning required to sustain the war effort in its various stages, and also finalize the line of attack to capture and hold Delhi, the capital, as well as other strategically important cities. The next challenge was to geographically allocate supplies to satisfy this location-specific demand forecast given that the emerging native army did not have the resources or the time to rapidly create and manage their own own supply line. The only viable solution was to outsource this task, which was accomplished via the Chapati (an unleavened Indian bread) code.
The Chapati Code
After the flood of lotuses, the English were bemused to see Chapatis being exchanged by the chiefs of some villages. Alarm bells went off and they managed to intercept Chapatis embedded with lotus seeds.
The English concluded that this was not another strange custom and that the exchange of lotuses and Chapatis was some kind of a secret handshake. Red lotuses weren't found in the hands of villagers, and seeded Chapatis were not found in garrisons. What historians did not fully realize was that the lotus and the Chapati distribution were the code; not merely Boolean flags, but a vector representation of numerical information relating to troop strength and battle plans. We now know that the Indian war planners sent Chapatis to the various villages along a directional chain graph on a Euclidean plane whose source was a major garrison, and the sink was an important military objective.
The men of the villages that were ready to support the war effort would requisition and stock food grains, and the women of the village would be required to prepare food in quantities proportional to the number of Chapatis they received. The village chief would pass on a similar number of Chapatis to the next village in the designated chain. There is little doubt now that this was a coordinated and planned war to achieve self-rule.
Breaking Down The Supply Chain
When the time was ripe, the sepoys mutinied on the pretext of greased cartridges (immortalized by the legend of Mangal Pandey), catching the EEIC and the Victorian government in England off guard, and the initial phase of the war went against the colonizers. However, once they recognized the logistical method employed by the natives, the reprisals were eerily Nazi-like: swift, decisive and genocidal, and in keeping with a pattern that was repeated a few times before India's political independence in 1947. Villages on these chain graphs that supported the war effort were interdicted. Emergency laws were enacted that essentially gave English officers the license to kill civilians based on suspicion. Large populations, including women and children were wiped out, successfully disrupting the Indian supply chain.
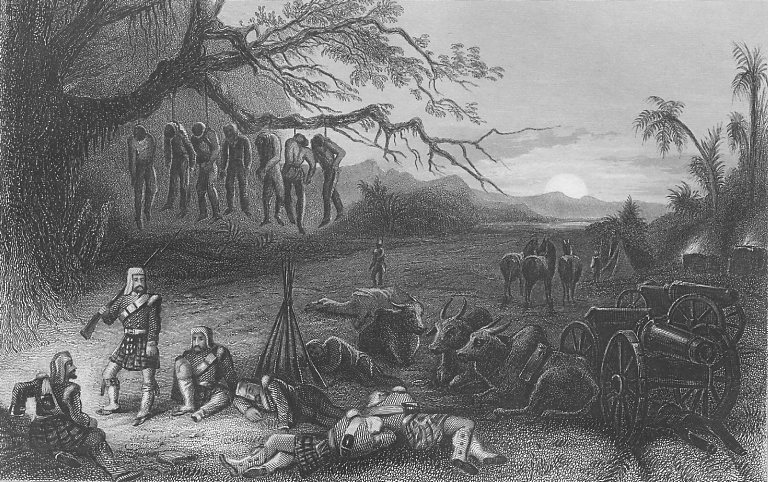
Once the logistical backbone was broken, it was a matter of time before the colonials won the war. However, it turns out that the war also had some cascading international effects.
Global impact of the 1857 Indian War of Independence
The London government withdrew huge sums of money from their banks and investments, including prominent financial institutions in the U.S, to raise sufficient capital to fund and ship out tens of thousands of fresh troops to India to win the war, while publicly spinning this fiasco as a localized case of mutiny. This behavior did not escape the attention of some Americans who questioned the official version.
.
ORL notes another pertinent question that George Train asked: "England says they are short of funds. Where are the hundreds of millions of silver that have been shipped there [India], disturbing the currency of the world?
The withdrawal of such huge sums of money by the English from US banks exacerbated the panic of 1857, and the resultant liquidity problem severely impacted the Northern states in the US besides triggering the world's first ever global economic crisis. Furthermore, the war hit the EEIC-pirated textile goods exported from India to the west, which reacted by sourcing more cotton from the southern US states that was being produced at even cheaper rates using African slave labor, thereby boosting the Confederate economy and morale. Thus, the Anglo-Indian war of 1857 appears to also have had some impact on the subsequent American civil war of 1861-65.
Jules Verne's Phineas Fogg is most likely based on George Train, a remarkable real-life American adventurer-entrepreneur who went around the world a few times, including a round trip in 67 days.
Legacy
It is less known that the Indian resistance achieved a few tangible victories for India in the long term. For brevity, we will have to leave that discussion for another day. India lost the 1857 war but those who resisted genocide became legend; none more so than the heroic young queen, Rani Lakshmi Bai. This coming Monday, November 19 is her birthday. Reading the immortal line in the Hindi poem about her in the candlelight as a kid, and then again a few days ago about her incredible exploits in ORL even as hurricane winds howled outside, never fails to bring a lump to the throat.
खूब लड़ी मर्दानी वह तो झाँसी वाली रानी थी।।
"She who gallantly fought a man's battle, was our Queen of Jhansi".
Sunday, October 28, 2012
Analytics and Cricket - IX : Book cricket v/s T20 cricket
Introduction
This previous post on cricket in this tab can be found here. We discovered how long a game of snakes and ladders is expected to last a while ago. Calculating the duration of a book-cricket game appears to be relatively simpler. It's a two-player game that used to be popular among kids in India and requires a book (preferably a thick one with strong binding), a pencil, and a sheet of paper for scoring. A player opens a random page, and notes down the last digit on the left (even numbered) page.

A page value of 'zero' indicates that the player is out, and an '8' indicates a single run (or a no-ball). The remaining possibilities in the sample space {2, 4, 6} are counted as runs scored off that 'ball'. A player keeps opening pages at random until they are out. Here's a sample inning from a simple simulation model of traditional book-cricket:
6, 2, 2, 1, 4, 4, 1, 2, 1, 2, 4, 2, 1, 4, 6, 6, 6, 4, 0
score is 58 off 19 balls
The counting process terminates when the first zero is encountered. Given this game structure, we try to answer two questions: What is the expected duration of a player's inning, and what the expected team total is (i.e., across 10 individual innings).
Conditional Probability Model
Assume a page is opened at random and the resultant page values are IID (uniform) random variables.
Let p(i) = probability of opening page with value i, where
p(i) = 0 if i is odd, and equals 0.2 otherwise.
D = E[Duration of a single inning]
S = E[Score accumulated over a single inning]
Conditioning on the value of the first page opened, and noting that the counting process resets for non-zero page values:
D = 1*0.2 + (1+D)*4 *0.2
⇒ D = 5.
Next, let us compute F, the E[score in a single delivery]:
F = 0.2*(0+2+4+6+1) = 2.6 runs per ball, which yields a healthy strike rate of 260 per 100 balls
S = FD = 13 runs per batsman, so we can expect a score of 130 runs in a traditional book-cricket team inning that lasts 50 balls on average.
Introduction of the Free-Hit
The International Cricket Conference (ICC) added a free-hit rule to limited overs cricket in 2007. To approximate this rule, we assume that a page ending in '8' results in a no-ball (one run bonus, like before) that also results in a 'free hit' the next delivery, so the player is not out even if the number of the next page opened ends in a zero. This change will make an innings last slightly longer, and the score, a little higher. Here's a sample inning (a long one):
1, 6, 1, 0, 1, 4, 2, 2, 4, 6, 1, 6, 2, 4, 2, 4, 6, 6, 6, 4, 1, 1, 6, 0,
score is 76 off 24 balls
Note that the batsman was "dismissed" of the 4th ball but cannot be ruled 'out' because it is a free-hit as a consequence of the previous delivery being a no-ball. All such free-hit balls are marked in bold above.
D = 1*0.2 + (1+D)*0.2 + (1+D)*0.2 + (1+D)*0.2 + (1+d)*0.2
= 1.0 + 0.6D + 0.2d
where d = E[duration|previous ball was a no-ball]. By conditioning on the current ball:
d = (1 + d)*prob{current ball and previous ball are no-balls} + (1+D)*prob{current ball is not a no ball but previous ball was a no ball)
= (1+d)*0.2 + (1+D) * 0.8
⇒ d = 1.25+D
⇒ D = 1 + 0.6D + 0.2(1.25+D)
⇒ D = 6.25
Under the free-hit rule, a team innings in book-cricket lasts 62.5 balls on average, which is 12.5 page turns more than the traditional format. A neat way to calculate S is based on the fact that the free-hit rule only increases the duration of an inning on average, but cannot alter the strike rate that is based on the IID page values, so S = 6.25 * 2.6 = 16.25. To confirm this, let us derive a value for S the hard way by conditioning on the various outcomes of the first page turn:
S = 0*0.2 + (S+2)*0.2 + (S+4)*0.2 + (S+6)*0.2 + (s+1)*0.2
= 2.6 +0.6S + 0.2s.
where s = E[score|current ball is a no-ball] and can be expressed by the following recurrence equation:
s = (1 + s)*prob{next ball is a no-ball} + (r+S)*prob{next ball is not a no-ball), where
r = E[score in next ball | next ball is not a no-ball]
= 0.25*(0 + 2 + 4 + 6) = 3
Substituting for r, we can now express s in terms of S:
s = (1+s)*0.2 + (3+S) * 0.8
⇒ S = 2.6 + 0.6S + 0.2(3.25+S) = 16.25, as before.
Under the free-hit rule, the average team total in book cricket is 162.5 runs (32.5 runs more than the total achieved in the traditional format). The average strike rate based on legal deliveries, i.e. excluding no-balls, is 162.5 * 100/(0.8*62.5) = 325 per 100 balls. A Java simulation program yielded the following results:
num trials is 10000000
average score per team innings is 162.422832
average balls per team innings is 62.477603
average legal balls per team innings is 49.981687
scoring rate per 100 legal balls is 324.9646855657353
Result: In comparison to real-life T20 cricket (~ 120 balls max per team inning), book-cricket is roughly 50% shorter in duration, but the higher batting strike rate usually yields bigger team totals in book cricket. The fact that we can even rationally compare statistics between these two formats says something about the nature of T20 cricket!
The cost of front-foot no-balls and big wides in T20
We can use the simple conditional probability ideas used to analyze book-cricket to estimate the expected cost of bowling a front-foot no-ball and wide balls in real-life T20 matches by replacing the book-cricket probability model with a more realistic one:
Assume p[0] = 0.25, p[1] = 0.45, p[2] = 0.15, p[3] = 0.05, p[4] = 0.05, p[5] ~ 0, p[6] = 0.05, p[7, 8, ...] ~ 0.
E[score in a ball] = 0 + 0.45 + 0.3 + 0.15 + 0.2 + 0.3 =1.4
This probability model yields a reasonable strike rate of 140 per 100 balls)
E[cost | no ball] = 1 + 1.4 + 1.4 = 3.8
Bowling a front-foot no-ball in T20 matches is almost as bad as giving away a boundary (apart from paying the opportunity cost of having almost no chance of getting a wicket due to the no-ball and the subsequent free-hit). Similarly,
E[cost | wide-ball down the leg-side] = (5|wide and four byes)*prob{4 byes} + (1| wide but no byes)*prob{no byes} + 1.4.
Assuming a 50% chance of conceding 4 byes, the expected cost is 4.4. On average, a bowler may be marginally better off bowling a potential boundary ball (e.g., bad length) than risk an overly leg-side line that can result in 5 wides and a re-bowl.
More sophisticated simulation models based on actual historical data can help analyze more realistic cricketing scenarios and support tactical decision making.
Tuesday, October 23, 2012
The Gaussian Hare, the Laplacian Tortoise, and Big Data
Alternative Optimal Solutions
A recurrent theme of this tab is to highlight an important contribution of O.R decision modeling: alerting us to the presence of alternative optimal solutions (AOS). Prior posts relating to AOS can be found here and here.
Customers unfamiliar or uncomfortable with the jagged-edged linear programming (LP) models often seek refuge within the smooth world of classical calculus (a world now known to have been initially crafted by Kerala mathematicians, but i digress). Here, alpine slopes of gracefully changing functions invariably allow you to rapidly ski down to a uniquely best solution. Like the truism "Football is a simple game; 22 men chase a ball for 90 minutes and at the end, the Germans win", an applied math legend is that the Gaussian hare invariably trumps the Laplacian tortoise. Unless of course, modern day optimization solvers and decision science come into play and allow Laplace to overcome the various complications posed by non-smoothness. (Image below linked from http://www.econ.uiuc.edu)

Degeneracy
Well specified decision models in a variety of industrial situations admit plenty of good quality answers, so the problem is usually one of having 'too many' rather than too few options (my favorite academic researchers tackle increasingly difficult unsolved problems, whereas my favorite OR practitioners compete on identifying the easiest unsolved problems). A fundamental thumb-rule of practical decision optimization modeling is to advantageously exploit and defuse this often-deadly problem of 'degeneracy' that characterizes practical LP formulations, and a reasonably skilled analyst can turn a potential numerical liability of the LP model into a business analytical asset as follows.
AOS often hide in plain sight
The presence of alternative answers forces us to revisit our translation of business rules into an LP and devote some time toward gainfully analyzing the differences in the potential business impact of these seemingly equal solutions. The customer can use this feedback to re-examine and further refine his/her business goals and priorities. This process of iteratively improving the design specification provides valuable insight to customers, and helps setup a richer, and a more practical and robust optimization model. Not that a similar exercise is impossible to accomplish using smooth approximations - just that the flexibility afforded by an LP model is often superior, and the tool kits for analyzing LP solutions have gotten amazingly better over the years.
Means and Ends
It just doesn't make sense to crunch through 21st century "Big Data" analytics using bleeding edge data mining, econometric, and machine learning methods on the one hand, and on the other hand, downgrade to 19th century techniques, or random black-box methods to manage the underlying decision optimization problems and produce severely suboptimal and non-robust solutions. Using such shortcuts because "a quick one-iteration improvement is all that is needed" brings along with some risky side effects and potentially leaves a big chunk of 'Big-Data' value on the table. Do everybody a favor and upgrade to a Laplacian tortoise (e.g. CPLEX) and you will be surprised to see how fast it runs, especially on Big Data.
A recurrent theme of this tab is to highlight an important contribution of O.R decision modeling: alerting us to the presence of alternative optimal solutions (AOS). Prior posts relating to AOS can be found here and here.
Customers unfamiliar or uncomfortable with the jagged-edged linear programming (LP) models often seek refuge within the smooth world of classical calculus (a world now known to have been initially crafted by Kerala mathematicians, but i digress). Here, alpine slopes of gracefully changing functions invariably allow you to rapidly ski down to a uniquely best solution. Like the truism "Football is a simple game; 22 men chase a ball for 90 minutes and at the end, the Germans win", an applied math legend is that the Gaussian hare invariably trumps the Laplacian tortoise. Unless of course, modern day optimization solvers and decision science come into play and allow Laplace to overcome the various complications posed by non-smoothness. (Image below linked from http://www.econ.uiuc.edu)
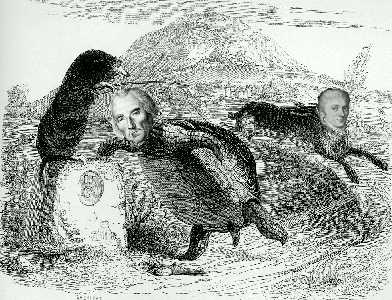
Degeneracy
Well specified decision models in a variety of industrial situations admit plenty of good quality answers, so the problem is usually one of having 'too many' rather than too few options (my favorite academic researchers tackle increasingly difficult unsolved problems, whereas my favorite OR practitioners compete on identifying the easiest unsolved problems). A fundamental thumb-rule of practical decision optimization modeling is to advantageously exploit and defuse this often-deadly problem of 'degeneracy' that characterizes practical LP formulations, and a reasonably skilled analyst can turn a potential numerical liability of the LP model into a business analytical asset as follows.
AOS often hide in plain sight
The presence of alternative answers forces us to revisit our translation of business rules into an LP and devote some time toward gainfully analyzing the differences in the potential business impact of these seemingly equal solutions. The customer can use this feedback to re-examine and further refine his/her business goals and priorities. This process of iteratively improving the design specification provides valuable insight to customers, and helps setup a richer, and a more practical and robust optimization model. Not that a similar exercise is impossible to accomplish using smooth approximations - just that the flexibility afforded by an LP model is often superior, and the tool kits for analyzing LP solutions have gotten amazingly better over the years.
Means and Ends
It just doesn't make sense to crunch through 21st century "Big Data" analytics using bleeding edge data mining, econometric, and machine learning methods on the one hand, and on the other hand, downgrade to 19th century techniques, or random black-box methods to manage the underlying decision optimization problems and produce severely suboptimal and non-robust solutions. Using such shortcuts because "a quick one-iteration improvement is all that is needed" brings along with some risky side effects and potentially leaves a big chunk of 'Big-Data' value on the table. Do everybody a favor and upgrade to a Laplacian tortoise (e.g. CPLEX) and you will be surprised to see how fast it runs, especially on Big Data.
Friday, October 12, 2012
Quoting an Optimal Price
Suppose you are an eBay-like online store operator selling wonderful home furniture sets made in Indonesia. For example a typical sofa set you sell may consist of a central offering in the form of a large three-person couch that is accompanied by a couple of matching chairs and tables (sample picture from an online wholesale dealer below).

While the center-piece tends to catch the eye of couch potatoes, you would like your customers to also buy the accessory pieces that go with this core product to boost your margin. To make this an attractive proposition, you recognize that every customer has a different willingness to pay and budget in mind. So rather than employ an inflexible fixed-price all-or-nothing approach, or risk a full-blown auction, you keep prospective buyers interested by allowing them to buy what they like and even quote their own price that you either accept or counter with a higher price. Unlike you, the buyer cannot see the price offers accepted and rejected in the past. How should you price a customer request taking all this information into account?
This scenario, as many would recognize, is not uncommon at all and plays out across multiple industries in the real and virtual world. Practitioners of Operations Research and Business Analytics creatively design a variety of probabilistic optimization models that allow a seller to provide a real-time price quote to a prospective buyer that maximizes the statistical chance of a profitable sale while staying within a customer's intended budget. Such mathematical bid-pricing methods help create a win-win situation by matching a customer's willingness-to pay with a seller's willingness to sell.
Where can you read more about such customized pricing models for bid response? A good start is the superb book on Pricing and Revenue Management by Robert Phillips or this pdf link. And if you are lucky enough to attend the Informs 2012 annual conference in Phoenix, AZ along with thousands of OR fans, a brilliant colleague of mine will be presenting a novel real-world instance not involving furniture, and talk about its tremendous business impact measured using non-monopoly currency. If real-life Integer Programming based probabilistic bid pricing can wake you up very very early in the morning, this talk is scheduled for 8 A.M, October 17.
While the center-piece tends to catch the eye of couch potatoes, you would like your customers to also buy the accessory pieces that go with this core product to boost your margin. To make this an attractive proposition, you recognize that every customer has a different willingness to pay and budget in mind. So rather than employ an inflexible fixed-price all-or-nothing approach, or risk a full-blown auction, you keep prospective buyers interested by allowing them to buy what they like and even quote their own price that you either accept or counter with a higher price. Unlike you, the buyer cannot see the price offers accepted and rejected in the past. How should you price a customer request taking all this information into account?
This scenario, as many would recognize, is not uncommon at all and plays out across multiple industries in the real and virtual world. Practitioners of Operations Research and Business Analytics creatively design a variety of probabilistic optimization models that allow a seller to provide a real-time price quote to a prospective buyer that maximizes the statistical chance of a profitable sale while staying within a customer's intended budget. Such mathematical bid-pricing methods help create a win-win situation by matching a customer's willingness-to pay with a seller's willingness to sell.
Where can you read more about such customized pricing models for bid response? A good start is the superb book on Pricing and Revenue Management by Robert Phillips or this pdf link. And if you are lucky enough to attend the Informs 2012 annual conference in Phoenix, AZ along with thousands of OR fans, a brilliant colleague of mine will be presenting a novel real-world instance not involving furniture, and talk about its tremendous business impact measured using non-monopoly currency. If real-life Integer Programming based probabilistic bid pricing can wake you up very very early in the morning, this talk is scheduled for 8 A.M, October 17.
Tuesday, October 9, 2012
Predicting the Future Size of the Nehru Dynasty
A glance through Indian newspapers will tell you about corruption in the highest places - specifically within India's so-called first family of Gandhis. Those not familiar with Indian politics would be surprised to find 'Gandhi' and 'corruption' in the same sentence. The puzzle is quickly resolved once you discover that this Gandhi family thankfully does not have the Mahatma in their family tree. This is the family of Nehrus, and at some point, a surviving daughter married a relatively unknown chap bearing that hallowed last name, engineering the most profitable branding coup the world has ever seen.
It is easy to write reams about how this family has institutionalized poverty and corruption in India over the last 60 years but it suffices for the purposes of this post to note that starting a few years prior to India's political independence from the British in 1947, members of the Nehru dynasty have directly or indirectly controlled (and destroyed) the futures of several hundred million Indians. Sadly, their level of incompetence has increased every generation, and as their numbers slowly grow, it becomes important for Indians to know this: how many dynasty members will a person have to get through to reclaim power in New Delhi in the future? Take a quick look at these time-series data in 20-year chunks:
Date Number Dynasty members
1924-1944: 0 No Nehru calling the shots
1944-1964: 1 Jawaharlal Nehru
1964-1984: 1 Indira Nehru Gandhi
1984-2004: 2 Rajiv Gandhi & Sonia Gandhi
2004-2014: 3 SoniaG, RahulG, & PriyankaG
----------------------------------------------------------------
2014-2024: 3 SoniaG, RahulG, & PriyankaG
2024-2044: 5 SG, RG, PG and PG's two children
The numbers below the dashed line are future predictions based on the current family count, and assuming that Priyanka's two kids today (Rahul is unmarried with no pending paternity cases) will be baptized into the family tradition of absolute power in their 20s-30s, like every generation before them.
Of course, it should not be surprising that the counts shown above are exactly the first six numbers of the Fibonacci sequence. There is another interesting case of poetic injustice in the nomenclature that is hidden here. Calling them Fibonacci numbers perpetuates an injustice to the mathematicians in India who discovered the series a long time before Fibonacci and unlike the Gandhi-Nehru mix up, this fact was well-known outside India too.
It is easy to write reams about how this family has institutionalized poverty and corruption in India over the last 60 years but it suffices for the purposes of this post to note that starting a few years prior to India's political independence from the British in 1947, members of the Nehru dynasty have directly or indirectly controlled (and destroyed) the futures of several hundred million Indians. Sadly, their level of incompetence has increased every generation, and as their numbers slowly grow, it becomes important for Indians to know this: how many dynasty members will a person have to get through to reclaim power in New Delhi in the future? Take a quick look at these time-series data in 20-year chunks:
Date Number Dynasty members
1924-1944: 0 No Nehru calling the shots
1944-1964: 1 Jawaharlal Nehru
1964-1984: 1 Indira Nehru Gandhi
1984-2004: 2 Rajiv Gandhi & Sonia Gandhi
2004-2014: 3 SoniaG, RahulG, & PriyankaG
----------------------------------------------------------------
2014-2024: 3 SoniaG, RahulG, & PriyankaG
2024-2044: 5 SG, RG, PG and PG's two children
The numbers below the dashed line are future predictions based on the current family count, and assuming that Priyanka's two kids today (Rahul is unmarried with no pending paternity cases) will be baptized into the family tradition of absolute power in their 20s-30s, like every generation before them.
Of course, it should not be surprising that the counts shown above are exactly the first six numbers of the Fibonacci sequence. There is another interesting case of poetic injustice in the nomenclature that is hidden here. Calling them Fibonacci numbers perpetuates an injustice to the mathematicians in India who discovered the series a long time before Fibonacci and unlike the Gandhi-Nehru mix up, this fact was well-known outside India too.
Thursday, September 27, 2012
Optimizing Your Airport Baggage Claim Experience
You rub your weary eyes and get off that Airbus 380 to signal the end of your long 16-hour flight and wearily make your way to the baggage claim. You patiently wait along with your family to pick up your 4-6 pieces of check-in luggage before proceeding through the customs and immigration checks. It's a tiresome and time consuming process. Is there a way you can make things better for yourself? Perhaps...
Decision Problem
What is the most strategic location along the snake-like baggage claim conveyor belt to position oneself?
First, here's a sample picture of the baggage claim area (in the new Bangalore International Airport in India. source: inmagine.com)

Data
The one in the picture above looks like a standard belt with a single 'U' bend. To support passengers disembarking from an A-380, perhaps a longer belt having more than one 'U' may be required. Let us label each element of data we come across. Most of the data that we sift through below may not be needed, but it may be handy for other related analysis in the future.
As a first approximation, we simplify the topography by stretching out the belt in a straight line along one dimension. We thus have a simple chain-link graph having a single origin ('o') and destination node ('d'), and total o-d path length 'L'. Furthermore, 'd' is reconnected back to 'o' to create a cyclical network (and a circulation system, and a queuing system, and a multicommodity flow network). Let the average length of each bag be 'w'. We assume that the bags move at a constant velocity 'v', even though the value of 'v' itself may drop if the belt is heavily loaded (e.g. v = 0, if somebody checked in an elephant). Let the total supply (inventory) of bags that is to be circulated through the conveyor belt be 'N'. For simplicity, we assume that each passenger has checked in one bag and line up along the belt to pick up their bag if they manage to ID it in a timely manner. Flow through this simple network stops after a certain number of cycles have been completed (we could ignore this rule for simplicity), or after the inventory is depleted to zero, whichever occurs first. We assume that the supply at 'o' is replenished periodically as the baggage trucks roll in, every 'k' cycles, until all inventory has been offloaded.
Analysis
The number of bags displayable on the belt at any time is bounded by n = L/w, where typically n << N. The density (defined as bags per unit length) is a non-increasing function of the distance from 'o' at all times, since bags can only be removed from the belt between 'o' and 'd'. In other words, the 'n' bags are not distributed uniformly, and the density is maximum near 'o', and at a minimum near 'd'. A person nearest 'o' will have to scan a lot more bags on the average before a successful match - and due to the recycling of unmatched supply, he may end up scanning some bags more than once. (Perhaps the expected number of scans can be calculated using the above data, but I suspect simulation may be an easier alternative.) On the other hand, the person waiting nearest 'd' has the least amount of work to do, since every successful match upstream means one less failed scan for her. In the extreme case, if every other passenger correctly identified their own bag the first time they see it, the person at 'd' would have to do zero work. The first bag that would show up in front of her would be hers and she can simply pick it up.
Recommendation
If the objective is to least strain your already tired eyes, perhaps it's best that you wait near 'd'.
However, we often see people get off a plane and head right for 'o'. From a safety perspective, the bags belonging to people waiting near 'o' are likely to traverse the belt the least, minimizing the chances of a bag being mistakenly matched or stolen. From a security perspective, waiting near 'o' makes sense. It seems some airports now check luggage tags before allowing a passenger to exit the baggage claim area, so this safety objective may not be useful for long. There are other obvious considerations such as picking a spot that is least crowded. If we assume that the probability 'p' that a passenger identifies their own bag in a timely manner is inversely related to the passenger density in their neighborhood and bag density, a primary consideration may be to just find a sparsely populated spot. Among such sparse spots, the one closer to 'd' may be a better option. On the other hand, the expected benefit from such a policy diminishes if too many passengers choose to be close to 'd', resulting in congestion. Finally, the state of the system changes over time. As the inventory depletes and passengers randomly exit the system, it may be worth relocating if you have the energy to do it.
All this stuff is useful provided your airline has not misplaced your bags in the first place.
Decision Problem
What is the most strategic location along the snake-like baggage claim conveyor belt to position oneself?
First, here's a sample picture of the baggage claim area (in the new Bangalore International Airport in India. source: inmagine.com)

Data
The one in the picture above looks like a standard belt with a single 'U' bend. To support passengers disembarking from an A-380, perhaps a longer belt having more than one 'U' may be required. Let us label each element of data we come across. Most of the data that we sift through below may not be needed, but it may be handy for other related analysis in the future.
As a first approximation, we simplify the topography by stretching out the belt in a straight line along one dimension. We thus have a simple chain-link graph having a single origin ('o') and destination node ('d'), and total o-d path length 'L'. Furthermore, 'd' is reconnected back to 'o' to create a cyclical network (and a circulation system, and a queuing system, and a multicommodity flow network). Let the average length of each bag be 'w'. We assume that the bags move at a constant velocity 'v', even though the value of 'v' itself may drop if the belt is heavily loaded (e.g. v = 0, if somebody checked in an elephant). Let the total supply (inventory) of bags that is to be circulated through the conveyor belt be 'N'. For simplicity, we assume that each passenger has checked in one bag and line up along the belt to pick up their bag if they manage to ID it in a timely manner. Flow through this simple network stops after a certain number of cycles have been completed (we could ignore this rule for simplicity), or after the inventory is depleted to zero, whichever occurs first. We assume that the supply at 'o' is replenished periodically as the baggage trucks roll in, every 'k' cycles, until all inventory has been offloaded.
Analysis
The number of bags displayable on the belt at any time is bounded by n = L/w, where typically n << N. The density (defined as bags per unit length) is a non-increasing function of the distance from 'o' at all times, since bags can only be removed from the belt between 'o' and 'd'. In other words, the 'n' bags are not distributed uniformly, and the density is maximum near 'o', and at a minimum near 'd'. A person nearest 'o' will have to scan a lot more bags on the average before a successful match - and due to the recycling of unmatched supply, he may end up scanning some bags more than once. (Perhaps the expected number of scans can be calculated using the above data, but I suspect simulation may be an easier alternative.) On the other hand, the person waiting nearest 'd' has the least amount of work to do, since every successful match upstream means one less failed scan for her. In the extreme case, if every other passenger correctly identified their own bag the first time they see it, the person at 'd' would have to do zero work. The first bag that would show up in front of her would be hers and she can simply pick it up.
Recommendation
If the objective is to least strain your already tired eyes, perhaps it's best that you wait near 'd'.
However, we often see people get off a plane and head right for 'o'. From a safety perspective, the bags belonging to people waiting near 'o' are likely to traverse the belt the least, minimizing the chances of a bag being mistakenly matched or stolen. From a security perspective, waiting near 'o' makes sense. It seems some airports now check luggage tags before allowing a passenger to exit the baggage claim area, so this safety objective may not be useful for long. There are other obvious considerations such as picking a spot that is least crowded. If we assume that the probability 'p' that a passenger identifies their own bag in a timely manner is inversely related to the passenger density in their neighborhood and bag density, a primary consideration may be to just find a sparsely populated spot. Among such sparse spots, the one closer to 'd' may be a better option. On the other hand, the expected benefit from such a policy diminishes if too many passengers choose to be close to 'd', resulting in congestion. Finally, the state of the system changes over time. As the inventory depletes and passengers randomly exit the system, it may be worth relocating if you have the energy to do it.
All this stuff is useful provided your airline has not misplaced your bags in the first place.
Thursday, September 20, 2012
FDI in Indian Retail: Good or Bad for India? In 100 Words or Less
Is building a hospital in an Indian town good? sure
If congress workers construct it? no.
Building a road generally a good idea? yes.
If the congress party supervises? nope.
Whether 'FDI* in retail' is bad or good strategy for India is moot. If its execution is mangled, it will end up being a horrific loss. A 60+ year trail of evidence supports this indictment of the Congress party.
"Amateurs Talk about Strategy, Dilettantes Talk about Tactics, and Professionals Talk about Logistics". The original quote is usually attributed to General Omar. Bradley, the "People's General".
(FDI = Foreign Direct Investment. 'FDI in Retail' may well be the proverbial straw the breaks the ruling Congress party's back.)
If congress workers construct it? no.
Building a road generally a good idea? yes.
If the congress party supervises? nope.
Whether 'FDI* in retail' is bad or good strategy for India is moot. If its execution is mangled, it will end up being a horrific loss. A 60+ year trail of evidence supports this indictment of the Congress party.
"Amateurs Talk about Strategy, Dilettantes Talk about Tactics, and Professionals Talk about Logistics". The original quote is usually attributed to General Omar. Bradley, the "People's General".
(FDI = Foreign Direct Investment. 'FDI in Retail' may well be the proverbial straw the breaks the ruling Congress party's back.)
Tuesday, September 4, 2012
Visiting the Land of the Ramayana
India is timeless. Returning from there is always the difficult part and every trip to the land of the Ramayana and the Mahabharata invariably feels too short, and the most recent visit to South India was no exception.
India frustrates. Six decades of Soviet-style centralized planning after two centuries of looting by the British has wrecked the post-independence economy and sapped much of it's optimism. Economic liberalization introduced in the 1990s to rescue the economy has now slowed down. India is living proof that populist socialism works wonderfully in theory, but in practice brutally extinguishes the hopes and lives of millions. I have had first hand experience. India's first and foremost modern ORMS and analytics practitioner, P. C. Mahalanobis constructed large-scale linear programming models in the 1950s to optimize such grand centralized planning goals - an exercise in futility and certainly not the science and practice of 'better'!
 (pic source: www.famousscientists.org)
Incidentally, one of the members of today's NAC (national advisory council), an unaccountable group of secretive leftist planners that work totally outside the purview of the Indian parliament, is Jean Dreze, a naturalized Indian citizen from Belgium who appears to have learned the art of coming up with equally grand centralized planning models (for the 21st century) from his father, who was both an operations researcher and economist. Not surprisingly, these grand schemes have failed miserably during human testing. It seems the modeling assumptions did not account for reality.
Mahalanobis did however leave behind a positive legacy. He founded the Indian Statistical Institute that produces many smart ORMS and statistics graduates to this day. He was a contemporary of the legendary Srinivasa Ramanujan and there is a well-recorded story of PCM posing a math problem to the young math genius from Tamil Nadu, who while cooking, answered the question and also provided a solution to the more general case.
Perhaps a major reason why India still has above-average GDP growth is the natural entrepreneurial spirit of its talented people that simply refuses to die. There is a market for everything in India.
India enchants. By the time I wake up in the morning in my ancestral village in the temple state of Tamil Nadu, my mother has created her Kolam (Rangoli) patterns in front of the house.
 (pic source: /farm3.staticflickr.com)
In the old days, the designs were done using rice flour, so the little ants could feed on it. According to Indian belief, all living creatures, big or small, have souls just like humans. I doubt if my mother bothered to check if the Kolam path she traced every morning for the last 40 years was a Hamiltonian circuit or not ...
 (pic source: 3.bp.blogspot.com)
India challenges. We board a train from Bangalore to Chennai. The seats are numbered sequentially but the ticket does not provide a deterministic clue on whether we have an aisle or middle seat. My family has contiguous seat numbers, but we soon discover that the seats themselves are not. A sole traveler shifting away from his window seat would have solved the problem in a jiffy but he refuses to oblige. We discover two other families facing the same problem. We perform an elegant three-way swap that would have made Lin and Kernighan proud, and enjoy a global optimal solution to this combinatorial problem for the remainder of the journey. It's about time the Indian Railways switches to alphanumeric seat labels.
India corrupts. I notice the beginnings of a flyover (overpass) in my village-town. Clearly there doesn't seem to be a need for it since the benefit/cost ratio seemed rather poor, but the politicians wanted one, so the town has to endure it. They're also widening the train tracks that go thru the town, which actually appears to be a sane idea. However, they want to rebuild a working bridge to accommodate this change. The crazy guys try to demolish the old bridge, but it proves to be too strong, so work is delayed. Eventually the new one will come up and will most likely be built with sub-standard building material.
India heals. I visit the temple of my Ishta Devta (approximately translates to: 'preferred iconic embodiment of the divine') that is located on a hill in Pazhani,Tamil Nadu. In the past, many fervently monotheist invaders of India mistook this sophisticated Indian concept for "idol worship", leading to genocide and wholesale temple destruction. sigh.
 (pic source: upload.wikimedia.org)
I visit this famous temple the traditional way by climbing the many hundred steps to the summit. It's also a great morning work out. My family choose the popular modern mode of transportation and take the cable-car and arrive 30 minutes later! There appears to be a classical circulation problem hidden there.
 (pic source: commondatastorage.googleapis.com)
The temple staff appear to be practicing some form of revenue management while also maximizing cable car capacity utilization. Uphill rides are twice as expensive as riding down, off-peak rides are half-price, and they wait until the cars are at capacity before launching. Hence the delay. Once inside the temple complex on the top, the administrators appear to employ 'lot sizing' where people line up and then ushered in to view the Murthi (icon) of the deity in batches that seem to be somewhat synchronized with cable car arrivals at the top. Thus I derive no significant advantage in getting to the top earlier than the cable-car riders. You either wait at the bottom of the hill or on top and the total time spent in the system is practically constant.
India beckons. All said and done, I cant wait to get back. Until then, here's an audio sample of South Indian classical (Carnatic) vocal synced to Western instrumental music.
India frustrates. Six decades of Soviet-style centralized planning after two centuries of looting by the British has wrecked the post-independence economy and sapped much of it's optimism. Economic liberalization introduced in the 1990s to rescue the economy has now slowed down. India is living proof that populist socialism works wonderfully in theory, but in practice brutally extinguishes the hopes and lives of millions. I have had first hand experience. India's first and foremost modern ORMS and analytics practitioner, P. C. Mahalanobis constructed large-scale linear programming models in the 1950s to optimize such grand centralized planning goals - an exercise in futility and certainly not the science and practice of 'better'!
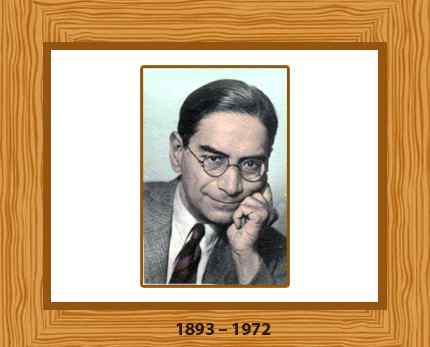
Incidentally, one of the members of today's NAC (national advisory council), an unaccountable group of secretive leftist planners that work totally outside the purview of the Indian parliament, is Jean Dreze, a naturalized Indian citizen from Belgium who appears to have learned the art of coming up with equally grand centralized planning models (for the 21st century) from his father, who was both an operations researcher and economist. Not surprisingly, these grand schemes have failed miserably during human testing. It seems the modeling assumptions did not account for reality.
Mahalanobis did however leave behind a positive legacy. He founded the Indian Statistical Institute that produces many smart ORMS and statistics graduates to this day. He was a contemporary of the legendary Srinivasa Ramanujan and there is a well-recorded story of PCM posing a math problem to the young math genius from Tamil Nadu, who while cooking, answered the question and also provided a solution to the more general case.
Perhaps a major reason why India still has above-average GDP growth is the natural entrepreneurial spirit of its talented people that simply refuses to die. There is a market for everything in India.
India enchants. By the time I wake up in the morning in my ancestral village in the temple state of Tamil Nadu, my mother has created her Kolam (Rangoli) patterns in front of the house.

In the old days, the designs were done using rice flour, so the little ants could feed on it. According to Indian belief, all living creatures, big or small, have souls just like humans. I doubt if my mother bothered to check if the Kolam path she traced every morning for the last 40 years was a Hamiltonian circuit or not ...

India challenges. We board a train from Bangalore to Chennai. The seats are numbered sequentially but the ticket does not provide a deterministic clue on whether we have an aisle or middle seat. My family has contiguous seat numbers, but we soon discover that the seats themselves are not. A sole traveler shifting away from his window seat would have solved the problem in a jiffy but he refuses to oblige. We discover two other families facing the same problem. We perform an elegant three-way swap that would have made Lin and Kernighan proud, and enjoy a global optimal solution to this combinatorial problem for the remainder of the journey. It's about time the Indian Railways switches to alphanumeric seat labels.
India corrupts. I notice the beginnings of a flyover (overpass) in my village-town. Clearly there doesn't seem to be a need for it since the benefit/cost ratio seemed rather poor, but the politicians wanted one, so the town has to endure it. They're also widening the train tracks that go thru the town, which actually appears to be a sane idea. However, they want to rebuild a working bridge to accommodate this change. The crazy guys try to demolish the old bridge, but it proves to be too strong, so work is delayed. Eventually the new one will come up and will most likely be built with sub-standard building material.
India heals. I visit the temple of my Ishta Devta (approximately translates to: 'preferred iconic embodiment of the divine') that is located on a hill in Pazhani,Tamil Nadu. In the past, many fervently monotheist invaders of India mistook this sophisticated Indian concept for "idol worship", leading to genocide and wholesale temple destruction. sigh.
I visit this famous temple the traditional way by climbing the many hundred steps to the summit. It's also a great morning work out. My family choose the popular modern mode of transportation and take the cable-car and arrive 30 minutes later! There appears to be a classical circulation problem hidden there.
The temple staff appear to be practicing some form of revenue management while also maximizing cable car capacity utilization. Uphill rides are twice as expensive as riding down, off-peak rides are half-price, and they wait until the cars are at capacity before launching. Hence the delay. Once inside the temple complex on the top, the administrators appear to employ 'lot sizing' where people line up and then ushered in to view the Murthi (icon) of the deity in batches that seem to be somewhat synchronized with cable car arrivals at the top. Thus I derive no significant advantage in getting to the top earlier than the cable-car riders. You either wait at the bottom of the hill or on top and the total time spent in the system is practically constant.
India beckons. All said and done, I cant wait to get back. Until then, here's an audio sample of South Indian classical (Carnatic) vocal synced to Western instrumental music.
Thursday, August 2, 2012
Optimal Location of Speed Limit Signs
One of the nice things about the relatively more recent automobile GPS products is that they are able to inform us of the current speed limit. Sometimes, when we take our eyes of the road for a second to grab a soda, we may have driven past a speed limit sign and be unaware of the new speed limit. Of course, there are times when the GPS unit itself does not display the speed limit for certain areas, and at other times, it is off by 10 mph, perhaps due to recent road updates. Like any decision support system, the GPS unit cannot be a fail-safe backup for user negligence.

The problem of optimally locating speed limit signs on a network must have been studied and solved a long time ago especially since the analysis of traffic and transportation networks has long been popular research area among ORMS folks. Perhaps there exists a practical combinatorial optimization problem in terms of determining minimal/safest/least ambiguous ways of locating speed signs in the presence of scarce resources and budget limits. A partial list of assumptions and constraints include:
- Speed limits change in discrete quantities of 5mph or 10 mph
- Every driver will treat the last speed limit sign (or update) they saw on the network as the prevailing speed limit
- Every driver at every point in the road network must be in unanimous agreement on what the speed limit is. This is the ideal situation.
- In practice, perhaps the above requirement can be relaxed to stipulate that any non-trivial ambiguity must be resolved with a certain time or distance threshold whose value is location-specific
- Different types of speed limit signs are possible - they may be time-dependent (day/night) as well as location-dependent (school, bridge, tunnel) - Speed limit values can be fixed or variable ("smart roads"). This requirement can potentially inject a dynamic optimization aspect into the problem.
Perhaps a greedy method may be sufficient to generate a good answer to the (fixed value) speed-limit signpost location problem. There are of course, numerous other related location optimization problems on road networks:
locating advertisement hoardings, direction/information signs, emergency vehicles, detours, etc. All these models appear to be well studied in the literature. The proliferation of smart-phones can also have an impact on future 'smart road network' design in general. All in all, location, location, location science continues to be a very interesting sub-area of Operations Research.


The problem of optimally locating speed limit signs on a network must have been studied and solved a long time ago especially since the analysis of traffic and transportation networks has long been popular research area among ORMS folks. Perhaps there exists a practical combinatorial optimization problem in terms of determining minimal/safest/least ambiguous ways of locating speed signs in the presence of scarce resources and budget limits. A partial list of assumptions and constraints include:
- Speed limits change in discrete quantities of 5mph or 10 mph
- Every driver will treat the last speed limit sign (or update) they saw on the network as the prevailing speed limit
- Every driver at every point in the road network must be in unanimous agreement on what the speed limit is. This is the ideal situation.
- In practice, perhaps the above requirement can be relaxed to stipulate that any non-trivial ambiguity must be resolved with a certain time or distance threshold whose value is location-specific
- Different types of speed limit signs are possible - they may be time-dependent (day/night) as well as location-dependent (school, bridge, tunnel) - Speed limit values can be fixed or variable ("smart roads"). This requirement can potentially inject a dynamic optimization aspect into the problem.
Perhaps a greedy method may be sufficient to generate a good answer to the (fixed value) speed-limit signpost location problem. There are of course, numerous other related location optimization problems on road networks:
locating advertisement hoardings, direction/information signs, emergency vehicles, detours, etc. All these models appear to be well studied in the literature. The proliferation of smart-phones can also have an impact on future 'smart road network' design in general. All in all, location, location, location science continues to be a very interesting sub-area of Operations Research.
Sunday, July 22, 2012
Ekthetikophobia: The Fear of the Exponential
More specifically, the fear of having to solve an NP-Hard optimization problem to save your job.
Do you or anyone else in your organization exhibit symptoms of Ekthetikophobia?
Sample Responses by Ekthetikophobes
1. Resign: Capitulation is by far the most common response, especially if the person does not have an ORMS background and is oblivious to the 'science of better'. Throw hands in the air, lose faith in humanity, and slurp spoonfuls of the nearest meta-heuristic algorithmic prescription provided by bees, ants, bacteria, squeaky wheels, mutant turtles, ... any nature cure that uses pseudo random numbers. This response is best captured by the Hindi proverb "Naach Na Jaane, Aaangan Teda",i.e., a bad dancer blames the uneven floor.
2. Controlled Panic. This is pretty typical of a generation of OR practitioners weaned on CPLEX. Like MDs trying to decode a deadly new strain of flu, the overriding urge is to throw money at the problem by ordering the latest versions of the baddest bunch of industrial strength optimization solvers in the market with matching supercomputing accessories to run massive benchmarks, and generally scare the pants off their IT managers who work with depression-era budgets.
3. Code. This is relatively more common to programming gurus and follows exactly one rule: If you throw sufficiently well-written code at any problem, it must work. This is so crazy, these guys are on to something here.
4. Publish. The median response from E.phobic research folks is to put this exhibit on a pedestal for everybody to gaze at. It's akin to a biologist discovering a new specie or an astronomer sighting a new planet that shouldn't have been there. Half of these people (surely OR types) will go on to demonstrate the monstrosity of this new problem based on diabolical worst case instances that even a God who plays dice would not inflict on mankind. The other, more elegant half (theoretical CS E.phobes) propose 'factor of 2' approximations that cover all remaining difficult instances missed by the Muggles, yet just as useful practically, before declaring victory. Then over the next two decades: keep shaving of that factor; rinse & repeat; it's a veritable cottage industry.
Exaggerations aside, ranked at the top of the most systematic, resourceful, innovative, and practically useful responses toward 'new' NP-Hard optimization problems must be the approach adopted by Dantzig, Fulkerson, and Johnson (1954) to tackle a 49-city Traveling Salesman Problem using 1950s computing technology and fearless minds that dared lasso the exponential.
July 22: minor fix: added missing text.
Do you or anyone else in your organization exhibit symptoms of Ekthetikophobia?
Sample Responses by Ekthetikophobes
1. Resign: Capitulation is by far the most common response, especially if the person does not have an ORMS background and is oblivious to the 'science of better'. Throw hands in the air, lose faith in humanity, and slurp spoonfuls of the nearest meta-heuristic algorithmic prescription provided by bees, ants, bacteria, squeaky wheels, mutant turtles, ... any nature cure that uses pseudo random numbers. This response is best captured by the Hindi proverb "Naach Na Jaane, Aaangan Teda",i.e., a bad dancer blames the uneven floor.
2. Controlled Panic. This is pretty typical of a generation of OR practitioners weaned on CPLEX. Like MDs trying to decode a deadly new strain of flu, the overriding urge is to throw money at the problem by ordering the latest versions of the baddest bunch of industrial strength optimization solvers in the market with matching supercomputing accessories to run massive benchmarks, and generally scare the pants off their IT managers who work with depression-era budgets.
3. Code. This is relatively more common to programming gurus and follows exactly one rule: If you throw sufficiently well-written code at any problem, it must work. This is so crazy, these guys are on to something here.
4. Publish. The median response from E.phobic research folks is to put this exhibit on a pedestal for everybody to gaze at. It's akin to a biologist discovering a new specie or an astronomer sighting a new planet that shouldn't have been there. Half of these people (surely OR types) will go on to demonstrate the monstrosity of this new problem based on diabolical worst case instances that even a God who plays dice would not inflict on mankind. The other, more elegant half (theoretical CS E.phobes) propose 'factor of 2' approximations that cover all remaining difficult instances missed by the Muggles, yet just as useful practically, before declaring victory. Then over the next two decades: keep shaving of that factor; rinse & repeat; it's a veritable cottage industry.
Exaggerations aside, ranked at the top of the most systematic, resourceful, innovative, and practically useful responses toward 'new' NP-Hard optimization problems must be the approach adopted by Dantzig, Fulkerson, and Johnson (1954) to tackle a 49-city Traveling Salesman Problem using 1950s computing technology and fearless minds that dared lasso the exponential.
July 22: minor fix: added missing text.
Thursday, July 19, 2012
Predicting the Value of a Bunch of Coins
This is the last part of the 'Coin trilogy'. Here's part-1 and part-2. In this post, we attempt to answer questions on predicting the value for a bunch of coins for which we only know its weight but not the exact internal distribution among coin types.
If somebody gave you the option of choosing either the value of a kilo of coins or 40$, which will you pick?
Using CPLEX, we determine that the maximum possible value for 1000 grams of pennies, nickels, dimes, and quarters is 44.05$, so if you took the 40$, there is a small chance you will incur a loss. If the bag was packed with 400 pennies (weighs exactly a kilo), you'll make a 36$ profit. If the coins types were uniformly distributed, its value would be about 26$, and you would make a 14$ profit.
Say you believe you have 100$ worth of coins in a jar that you want to cash out at a Coinstar machine. How much would that weigh? A lower bound for that answer is 2.268 Kilos. If the coin types were uniformly distributed in the jar, you would carry about 3.7 Kilos.
What kind of coin ratios does a vending machine carry? This online post author made enough purchases to empty out a vending machine and found this:
Quarters:Dimes:Nickels in the ratio 1:2:1.175
Assuming that the vending machine has to satisfy exact change for any value between 5c and 95c in 5c increments, a minimum weight solution is:
Nickels:1, Dimes:9 (10 coins, weight 25.412g) with zero quarters. However, by adding a secondary objective of also minimizing the number of coins (limited coin capacity?), we obtain the following alternative optimal solution that threw away 5 dimes and picked up 2 quarters:
Nickel:1, Dime:4, Quarter:2 (7 coins, 25.412g)
Quarters and Dimes are now present in the same ratio as that in the vending machine. However, our model doesn't like nickels much (although a melted nickel was once worth more than its value).
I have a digital counting jar that displays the current value of the coins currently in the jar. It currently reads $20.05, and its weight (excluding the empty jar) is about 700 grams. For this weight, the maximum value is 30.85$. If my coins were uniformly distributed in the jar, the model predicts a "maximum" value of 18.7$, which means that I have relatively more dimes and/or quarters in my mix. A dime and a nickel have the exact same bang-to-buck ratio, i.e. value/weight ratio, which is a source of the alternative optimal solutions discussed in part 2.
US Mint Production
Averaged over 2010-2011, the coins are produced in the approximate ratio:
p:n:d:q
12:1.5:3.5:1
Quite different from our preferred ratios calculated in part-1 and part-2. At this rate, my 700 gram jar would contain only about 15$ and a kilo of coins in this ratio would be worth about 18$.
If somebody gave you the option of choosing either the value of a kilo of coins or 40$, which will you pick?
Using CPLEX, we determine that the maximum possible value for 1000 grams of pennies, nickels, dimes, and quarters is 44.05$, so if you took the 40$, there is a small chance you will incur a loss. If the bag was packed with 400 pennies (weighs exactly a kilo), you'll make a 36$ profit. If the coins types were uniformly distributed, its value would be about 26$, and you would make a 14$ profit.
Say you believe you have 100$ worth of coins in a jar that you want to cash out at a Coinstar machine. How much would that weigh? A lower bound for that answer is 2.268 Kilos. If the coin types were uniformly distributed in the jar, you would carry about 3.7 Kilos.
What kind of coin ratios does a vending machine carry? This online post author made enough purchases to empty out a vending machine and found this:
Quarters:Dimes:Nickels in the ratio 1:2:1.175
Assuming that the vending machine has to satisfy exact change for any value between 5c and 95c in 5c increments, a minimum weight solution is:
Nickels:1, Dimes:9 (10 coins, weight 25.412g) with zero quarters. However, by adding a secondary objective of also minimizing the number of coins (limited coin capacity?), we obtain the following alternative optimal solution that threw away 5 dimes and picked up 2 quarters:
Nickel:1, Dime:4, Quarter:2 (7 coins, 25.412g)
Quarters and Dimes are now present in the same ratio as that in the vending machine. However, our model doesn't like nickels much (although a melted nickel was once worth more than its value).
I have a digital counting jar that displays the current value of the coins currently in the jar. It currently reads $20.05, and its weight (excluding the empty jar) is about 700 grams. For this weight, the maximum value is 30.85$. If my coins were uniformly distributed in the jar, the model predicts a "maximum" value of 18.7$, which means that I have relatively more dimes and/or quarters in my mix. A dime and a nickel have the exact same bang-to-buck ratio, i.e. value/weight ratio, which is a source of the alternative optimal solutions discussed in part 2.
US Mint Production
Averaged over 2010-2011, the coins are produced in the approximate ratio:
p:n:d:q
12:1.5:3.5:1
Quite different from our preferred ratios calculated in part-1 and part-2. At this rate, my 700 gram jar would contain only about 15$ and a kilo of coins in this ratio would be worth about 18$.
Tuesday, July 17, 2012
Alternative Optimal Solutions to the Coin Mix Problem
The solution to the 'optimal change' problem analyzed in the previous post is further examined from a practice perspective. Again, we use CPLEX to do this since it is quite convenient for such analyses.
Problem 1 is an integer knapsack problem that is known to be theoretically NP-Hard but fairly easy to solve in practice using Dynamic Programming. For this specific coin instance, enumeration with simple pruning rules that exploit the problem structure would work too.
Globally Robust versus Scenario-Optimal
Problem 2 is relatively trickier. It attempts to minimize the maximum weight across the feasible solutions to each of the change scenarios. The value of the 10-coin min-weight solution in the previous post:
First Among Equals
We only used a single goal within the optimization formulations: either min-sum, min-count, or min-weight. As mentioned in a recent post, practical optimization models almost never go into production carrying just a single goal. Consider these alternative optimal optimal solutions for 96c:
v # wt p n d q
96 9 24.046 1 0 7 1
96 6 24.046 1 0 2 3
The second solution has the same weight but fewer quarters + dimes, and does the same job a little more efficiently. On the other hand, the first solution perhaps allows greater flexibility in terms of meeting other change requests (e.g. 30c, 40c).
Continuing along this path,
a) if we set the lower bound on the number of dimes in Problem 2 = 7, we obtain the following 13-coin alternative to the 4-3-2-1 answer, having the same weight and value (36.546g, $1.04) PQDN::4171
b) If we want a least-value solution to Problem 2, then an optimal objective function value whose corresponding weight is only 1.5g more than the min-weight is 1.0$ (37.912g)
PQDN::5241 or PQDN::5091
(If you ever change a dollar bill in the future, do so in a robust manner via this mnemonic: PQDN 5241 :)
Interestingly, these 1$ solutions include five pennies (a feasible 4-penny solution has a value of 1.04$ or more).
Depending on the context, one of these solutions is more preferable than the others, and this preference can be quantified by suitably incorporating secondary and tertiary goals within the objective function. In contrast, a pure constraint satisfaction model will solely focus on generating feasible solutions ignoring any preference. These principles are the cornerstone of many mission-critical optimal planning systems and operational decision support applications deployed across industries.
Problem 1 is an integer knapsack problem that is known to be theoretically NP-Hard but fairly easy to solve in practice using Dynamic Programming. For this specific coin instance, enumeration with simple pruning rules that exploit the problem structure would work too.
Globally Robust versus Scenario-Optimal
Problem 2 is relatively trickier. It attempts to minimize the maximum weight across the feasible solutions to each of the change scenarios. The value of the 10-coin min-weight solution in the previous post:
Pennies:Quarters:Dimes:Nickels::4:3:2:1 is slightly more than a dollar (1.04$). This coin mix will be able to satisfy any random change request in the range 1-100c. Note: If we only cared about change between 1-99c, an optimal solution (35.412g, 99c) is: PQDN::4241.
However, while an optimal solution to Problem 2 is robust in terms of this ability to meet any request, it is not necessarily optimal in terms of meeting specific coin requests. For example, if we only ever use change for a 3pm $1.68 cup of Starbucks in the cafeteria, then the 4-3-2-1 solution may not be the best. However, if by chance, we choose to downsize to a smaller $1.29 cup one day, then the 68c solution may not work.First Among Equals
We only used a single goal within the optimization formulations: either min-sum, min-count, or min-weight. As mentioned in a recent post, practical optimization models almost never go into production carrying just a single goal. Consider these alternative optimal optimal solutions for 96c:
v # wt p n d q
96 9 24.046 1 0 7 1
96 6 24.046 1 0 2 3
The second solution has the same weight but fewer quarters + dimes, and does the same job a little more efficiently. On the other hand, the first solution perhaps allows greater flexibility in terms of meeting other change requests (e.g. 30c, 40c).
Continuing along this path,
a) if we set the lower bound on the number of dimes in Problem 2 = 7, we obtain the following 13-coin alternative to the 4-3-2-1 answer, having the same weight and value (36.546g, $1.04) PQDN::4171
b) If we want a least-value solution to Problem 2, then an optimal objective function value whose corresponding weight is only 1.5g more than the min-weight is 1.0$ (37.912g)
PQDN::5241 or PQDN::5091
(If you ever change a dollar bill in the future, do so in a robust manner via this mnemonic: PQDN 5241 :)
Interestingly, these 1$ solutions include five pennies (a feasible 4-penny solution has a value of 1.04$ or more).
Depending on the context, one of these solutions is more preferable than the others, and this preference can be quantified by suitably incorporating secondary and tertiary goals within the objective function. In contrast, a pure constraint satisfaction model will solely focus on generating feasible solutions ignoring any preference. These principles are the cornerstone of many mission-critical optimal planning systems and operational decision support applications deployed across industries.
Subscribe to:
Posts (Atom)